I don’t always swing for the fences…
But when I do, it’s because I either like the chart pattern, catalyst, or both.
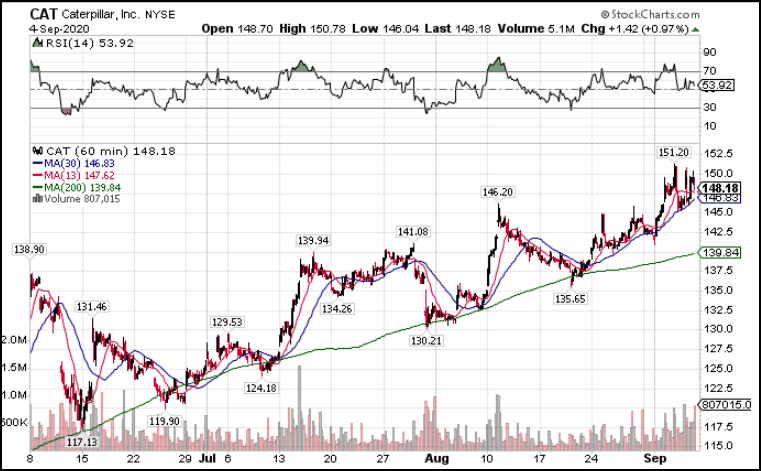
CAT Hourly Chart
Now, if it doesn’t look like much now, that’s okay.
Because I’m going to spend some time and detail why this setup has the potential to return 2-5x your money when you include options as part of your strategy.
Now…
You’re probably thinking – duh, it’s clearly in an uptrend.
Of course, the trend is an important component of the setup.
In fact, I would go as far as to say it’s the MOST important part of the setup.
But that’s not all.
What are other essential elements?
Understanding the big picture
Would you take a cross-country road trip only looking at a map of your current state?
Not if you don’t want to get lost.
People assume trading occurs in a vacuum. They look at the chart and assume no others exist in the world.
I’ve got news for you – even penny stocks are influenced by the broader market.
Yes, different markets influence each stock differently.
So, why not use that to your advantage?
I look at the chart like Caterpillar’s and I see an obvious uptrend.
But what I also see is significant relative strength compared to the broader market.
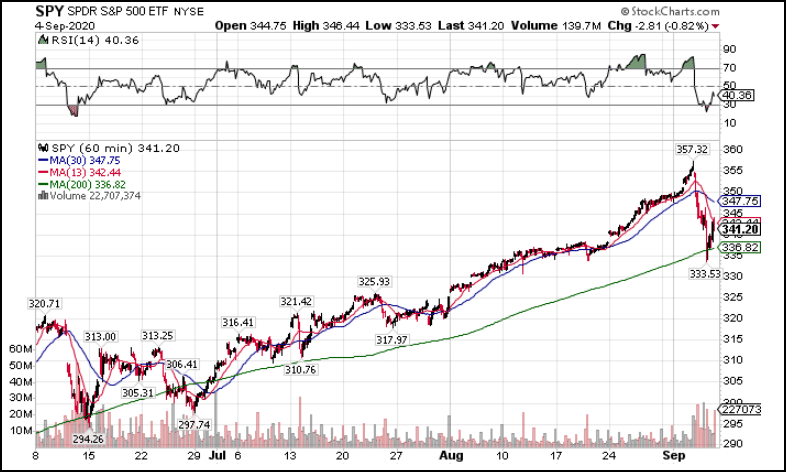
Here’s a picture of the SPY during that same timeframe.
SPY Hourly Chart
Even before the recent tumble in equities, Caterpillar significantly outperformed the SPY.
Why is that important?
Because it means buyers want this stock more than the general market.
And they’re willing to buy it on days when others are selling.
That usually means that when the markets do bounce back, Caterpillar’s stock outpaces the others.
Combining multiple signals
Relative outperformance and an uptrend aren’t enough for a setup.
A good setup combines multiple elements to key in a trade.
Imagine that there are groups of traders out there: trend followers, breakout traders, moving average players, etc.
Each of them has a certain amount of power to move price.
By combining multiple signals into a setup, you’re gathering all those forces and putting them behind you.
So who are the players I want to draft for my team?
The 200-period moving average
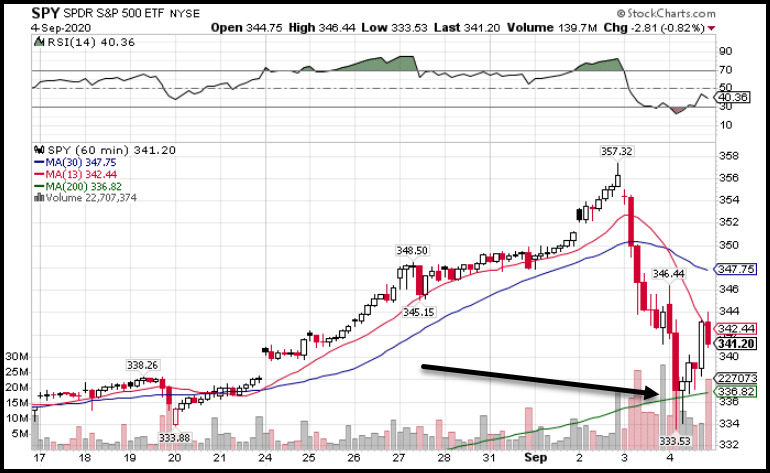
I’m so fond of the 200-period moving average on the hourly chart, I call it my gravitational line.
Just look at how it stopped the SPY from its freefall recently.
SPY Hourly Chart
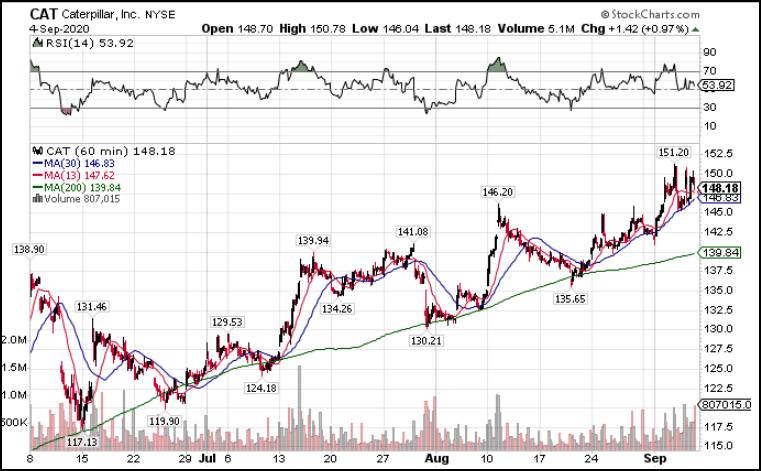
What I loved about the Caterpillar chart is how it simply rode the 200-period moving average higher.
CAT Hourly Chart
Look at the consistency by which that indicator held. Every time price traded into it, the stock bounced right back.
So what else do I want to increase my odds of success?
The consolidation pattern
Within that ascent there appeared one pattern that caught my eye.
Let me zoom you in on that area.
CAT Hourly Chart
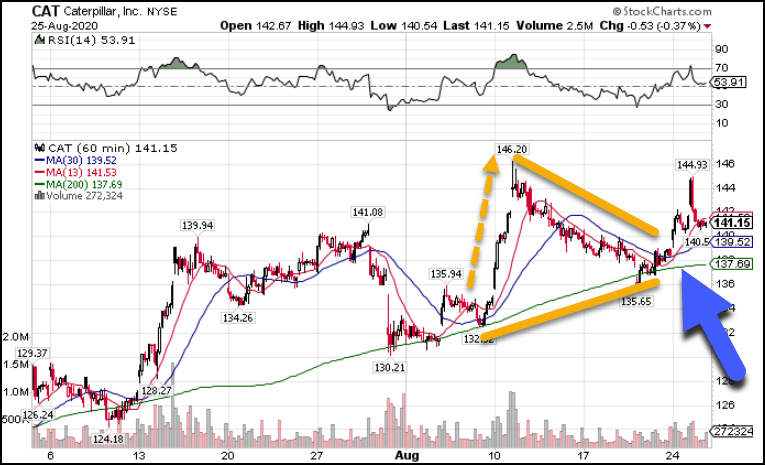
Within the chart I found a beautiful triangle consolidation pattern.
The dotted orange arrow shows how the stock made a sharp move higher. After a subsequent pullback, shares found support on…you guessed it, the 200-period moving average.
Again, these patterns aren’t enough by themselves.
But take the two points we discussed previously and now add in the chart pattern.
Things start to take shape.
But now I want to point you to one other key element.
See that blue arrow?
It’s pointing to a spot where the 13-period simple moving average crossed over the 30-period simple moving average.
This is what I refer to as my ‘money-pattern’ and is a strategic component to my High Octane Options service and proprietary scanner.
Seeing the crossover occur right on top of the 200-period moving average made this setup ideal.
Let’s review all the elements we found:
- Broader market move higher
- Consistent gravitational line support
- Moving average crossover on top of that support
- Chart consolidation pattern
That’s four different indicators all highlighting that as a good entry spot.
What’s even better is I have a clear stop out and target.
I can use a break of the recent highs at $146.20 as my target, and lows at $130.21 as my stop.
With price at $138, that gives me about $8 on either side, or a 50/50 risk/reward. As long as I make money with this trade more than half the time, I should come out on top.
Cutting through the clutter
One way I streamline my search for stocks is with my proprietary scanner for High Octane Options members.
Constantly at work, the scanner looks for my money-pattern across thousands of stocks.
Guess what…CAT came from that list.
And that’s just one of the opportunities it found…
See what you’ve been missing.
