As long as the Fed backstops the market, stocks can and will continue to trade higher.
And based on what they’re saying…they have no intention of putting their foot off the gas.
It’s one of the main reasons why some market pundits believe that some stocks and sectors are in bubble territory.
Let’s face it – companies like Workhorse (WKHS) or Virgin Galactic (SPCE) shouldn’t be worth what they are.
Heck, Workhorse hasn’t sold anything yet!
And when investors finally wake up and realize they’re holding onto air, the crash in these stocks will be severe.
Now, I am not writing this to scare you off.
I just want you to have some perspective here. There is a difference between investing and trading.
As long as you stick to trading, then you can trade anything.
That’s Why I focus on these four elements:
- Chart patterns
- Volume
- Candlestick formations
- Sentiment
Want to know how I put it all together and position myself to profit?
Which stocks are we talking about
If I applied the term liberally, Bubble Stocks could refer to any chart that is made a parabolic move. That puts Tesla in this category.
However, I want to limit the discussion to stocks that have no business trading where they are.
While I don’t always look at fundamentals (especially when trading) these are companies where you look at their current business and scratch your head.
Common indicators include:
- Zero revenues (excluding biotech)
- Excessive cash burn
- Extreme levels of debt
- No products to speak of
Compare Workhorse (WKHS) to LGI Homes (LGIH). Both have the same market capitalization. Yet, LGI is in a strong industry and does billions in sales, generating hundreds of millions in profits.
Then you look at the two charts and can clearly see the extreme move in Workhorse’s stock.
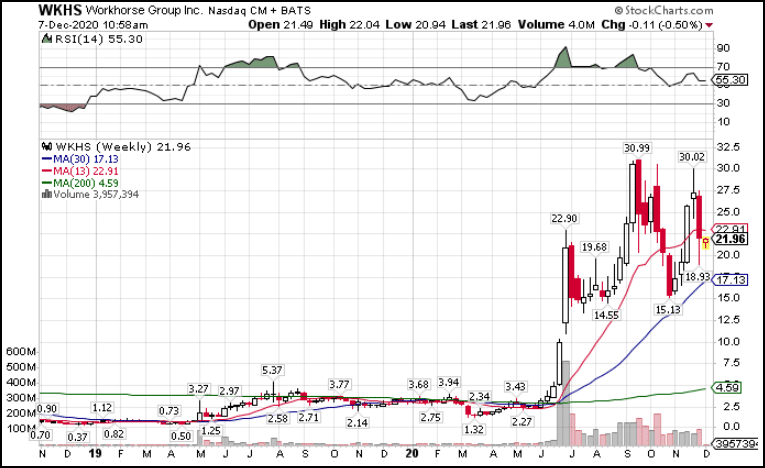
WKHS Weekly Chart
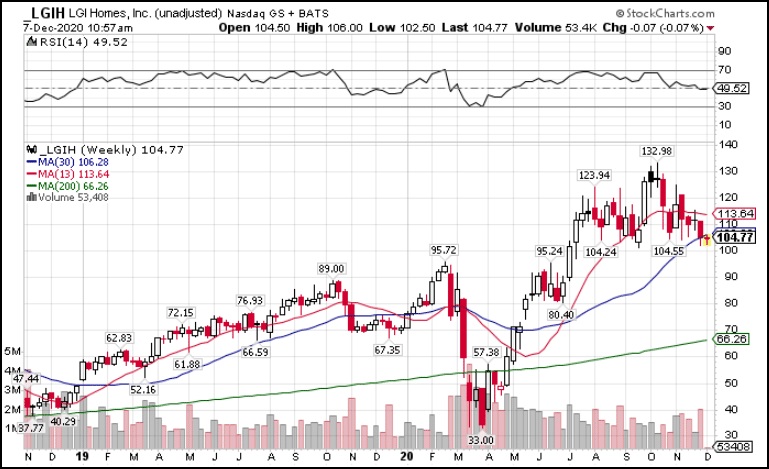
LGIH Weekly Chart
LGIH might be overbought, but WKHS rests entirely on a storyline that may or may not come true.
That’s why even the slightest bit of bad news can tank a stock, while worse news sends it in a downward spiral like Nikola (NKLA).
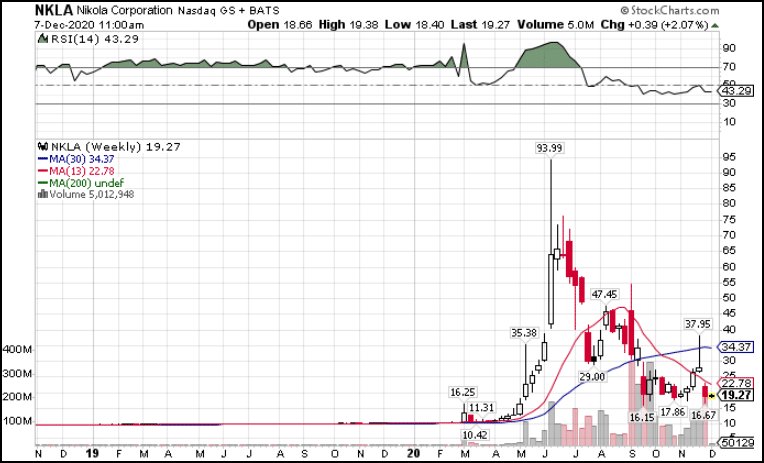
NKLA Weekly Chart
Volume & candlesticks
Bubble stocks go through a couple of phases. They all tend to end the same way.
The first phase is the initial parabolic move. You can see it in the chart of NKLA where it peaked out at $95.
After that shares tend to trade sideways while investors decide whether the next move is lower or higher.
Tops in stocks tend to contain two key variables: high volume and candlestick reversals.
Here’s an example with WKHS.
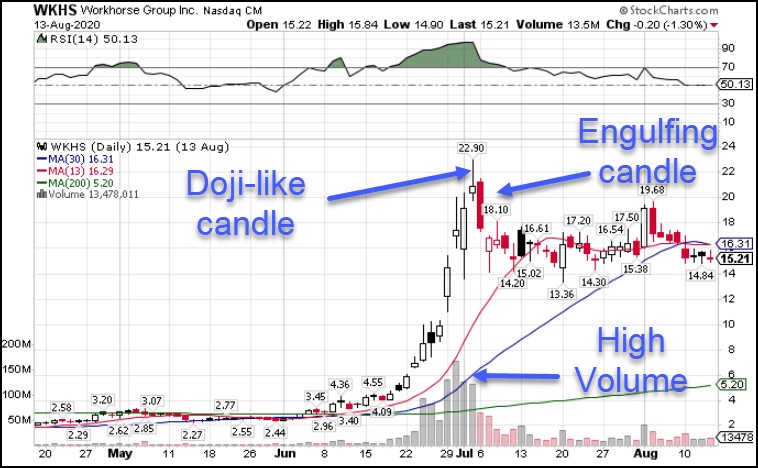
WKHS Daily Chart
Workhorse ran from below $5 to over $20 in a matter of weeks.
Volume increased from 2,000,000 shares per day (on $3) to 165,000,000 on $20.
In this chart, we got two types of reversal candles.
Reversal candles include dojis, tails, and engulfing candles.
Doji candles occur when the open and close are essentially the same.
Tail candles exhibit long wicks (tails) before closing at or below the open.
Engulfing candles often opens above the previous candle’s high or inside its body (open and close) and close below its low.
You can see here how the doji candle closed near the open. The next day, the candle closed well below the lows on similarly high volume.
Both of these indicated a top in the stock and an end to the first phase.
After a short pullback (which was still 20%), shares found a range, trading sideways until they decided on their next direction (which was higher).
Keep in mind, this type of topping formation occurs on different timeframes. Finding it on daily and weekly timeframes certainly means more. But, all reversals start on smaller ones like the hourly chart.
Sentiment
The other day, I was picking up my kids from a friend’s house and the parent stopped outside to say high.
After some small talk, they asked me what I thought about Tesla and NIO.
They knew I traded and I knew they never traded.
It sounds crazy, but when you start hearing about popular stocks from your friends, family, or folks at the grocery store, that’s when a stock is nearing its apex.
Big money watches the flows into these stocks and they take advantage of it.
They engineer stock moves to suck in traders like you and me at the top.
That’s when they pull out the rug, toppling us to fall flat on our face.
We can fight back against that by deploying technical analysis.
That includes what we discussed here as well as chart patterns like the one I go over in my upcoming workshop.
Don’t miss your chance to discover what this pattern can do for you.
