The S&P 500 has been on a tear, and it seems as if every week it makes new all-time highs.
To me, it just doesn’t feel as if these gains will stick right now.
Why?
THE MARKET IS HOLDING BACK!
You see, we could be in another record bull run instead of this half calf crawl.
And it’s all because of the VIX and short interest.
Both of these leading indicators signal a short-term pullback.
And once I explain what’s going on, you’ll see exactly how I plan to trade this minor crash.
Most of us know the VIX as the ‘fear gauge.’
What it measures is the demand for options on the S&P 500.
And that continues to remain at historically high levels.
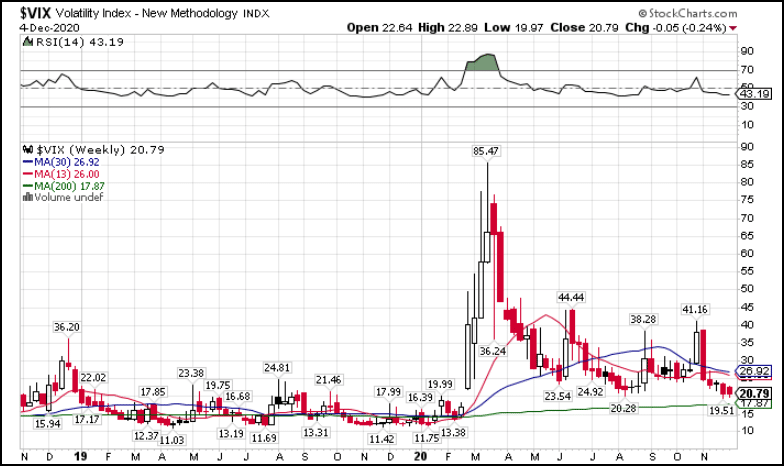
VIX Weekly Chart
At the same time, short-interest (bets against the market) continue to decline.
I know it sounds strange…
Fewer bears betting against the market should mean we rally, right?
Not exactly.
Let me explain why because it’s a bit counterintuitive.
Bulls need shorts
One of my favorite concepts is the short-squeeze.
A short-squeeze occurs when traders borrow shares from their broker to sell them in the open market. When a stock price drops, they repurchase the shares at the lower price, then give it back to the broker, making a profit on the difference.
But what happens when shares rise?
They lose money.
And when the losses get too large, the broker forces them to close their positions and stem the cash drain. It’s what’s known as a margin call.
To close the trade, shorts need to buy back the stock, which sends prices higher. That starts a chain reaction of shorts covering positions leading to an explosive move higher.
Without the short interest, higher price runs don’t have the power behind them.
Instead, they slowly creep higher, which can lead to stocks stalling out, much as we’ve seen here.
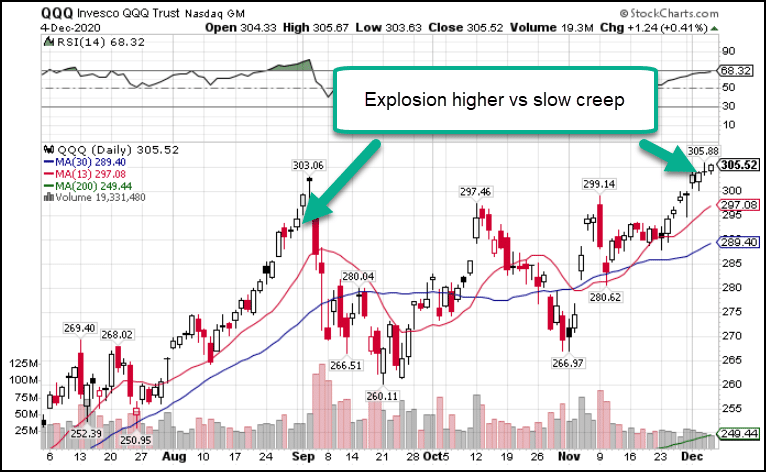
QQQ Daily Chart
What that means is we won’t see a sharp spike without one of two things – additional buying or a reset.
According to the VIX, additional buying isn’t likely.
Nervous laughter
You ever laugh at a joke but look around to make sure everyone else is as well?
That’s what bulls do right now.
In the last week, I saw dozens of pundits on television forecasting irrational numbers for the markets.
Their reasoning sounded like a toddler did their research.
They certainly aren’t looking at the VIX, which refuses to break below $20.
Why $20?
Because that was the low put in when the VIX first spiked on Coronavirus fears back in Q1.
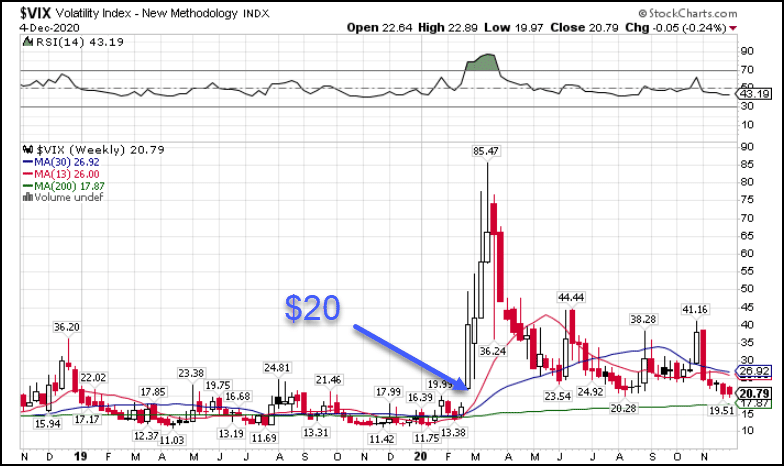
VIX Weekly Chart
And now, the 200-period weekly moving average has crept up towards that point as well, giving us another reason the VIX won’t head lower.
You see, an elevated VIX means traders and investors don’t trust the market. They continue to buy protection against potential pullbacks.
The epic run we took in 2019 happened with a VIX that could barely hold above $20 for more than a day.
For money to flow into the market, money that wants to invest rather than has no place else to go, this ‘fear’ needs to subside.
This is why I believe a pullback is coming in the next few weeks.
But don’t think that doesn’t create some sweet trades
Last week, we discussed a potential Santa Claus rally, where I laid out some killer statistics.
If you consider a possible ‘reset’, that means I should get a shot in the next few weeks to pick up some great companies at cheap prices.
And right around the end of options expiration week, we should hit a bottom.
Specifically, I’ll be looking at the 18th as a key date.
What will that look like?
Given the $20 base in the VIX, we’ll need to see a spike back up to $30+. At that point the VIX will have enough room to decline, giving the market leeway to bounce back.
That will be a point where I want to use my investment options strategy – cash covered puts.
Right now, the portfolio looks pretty darn good.
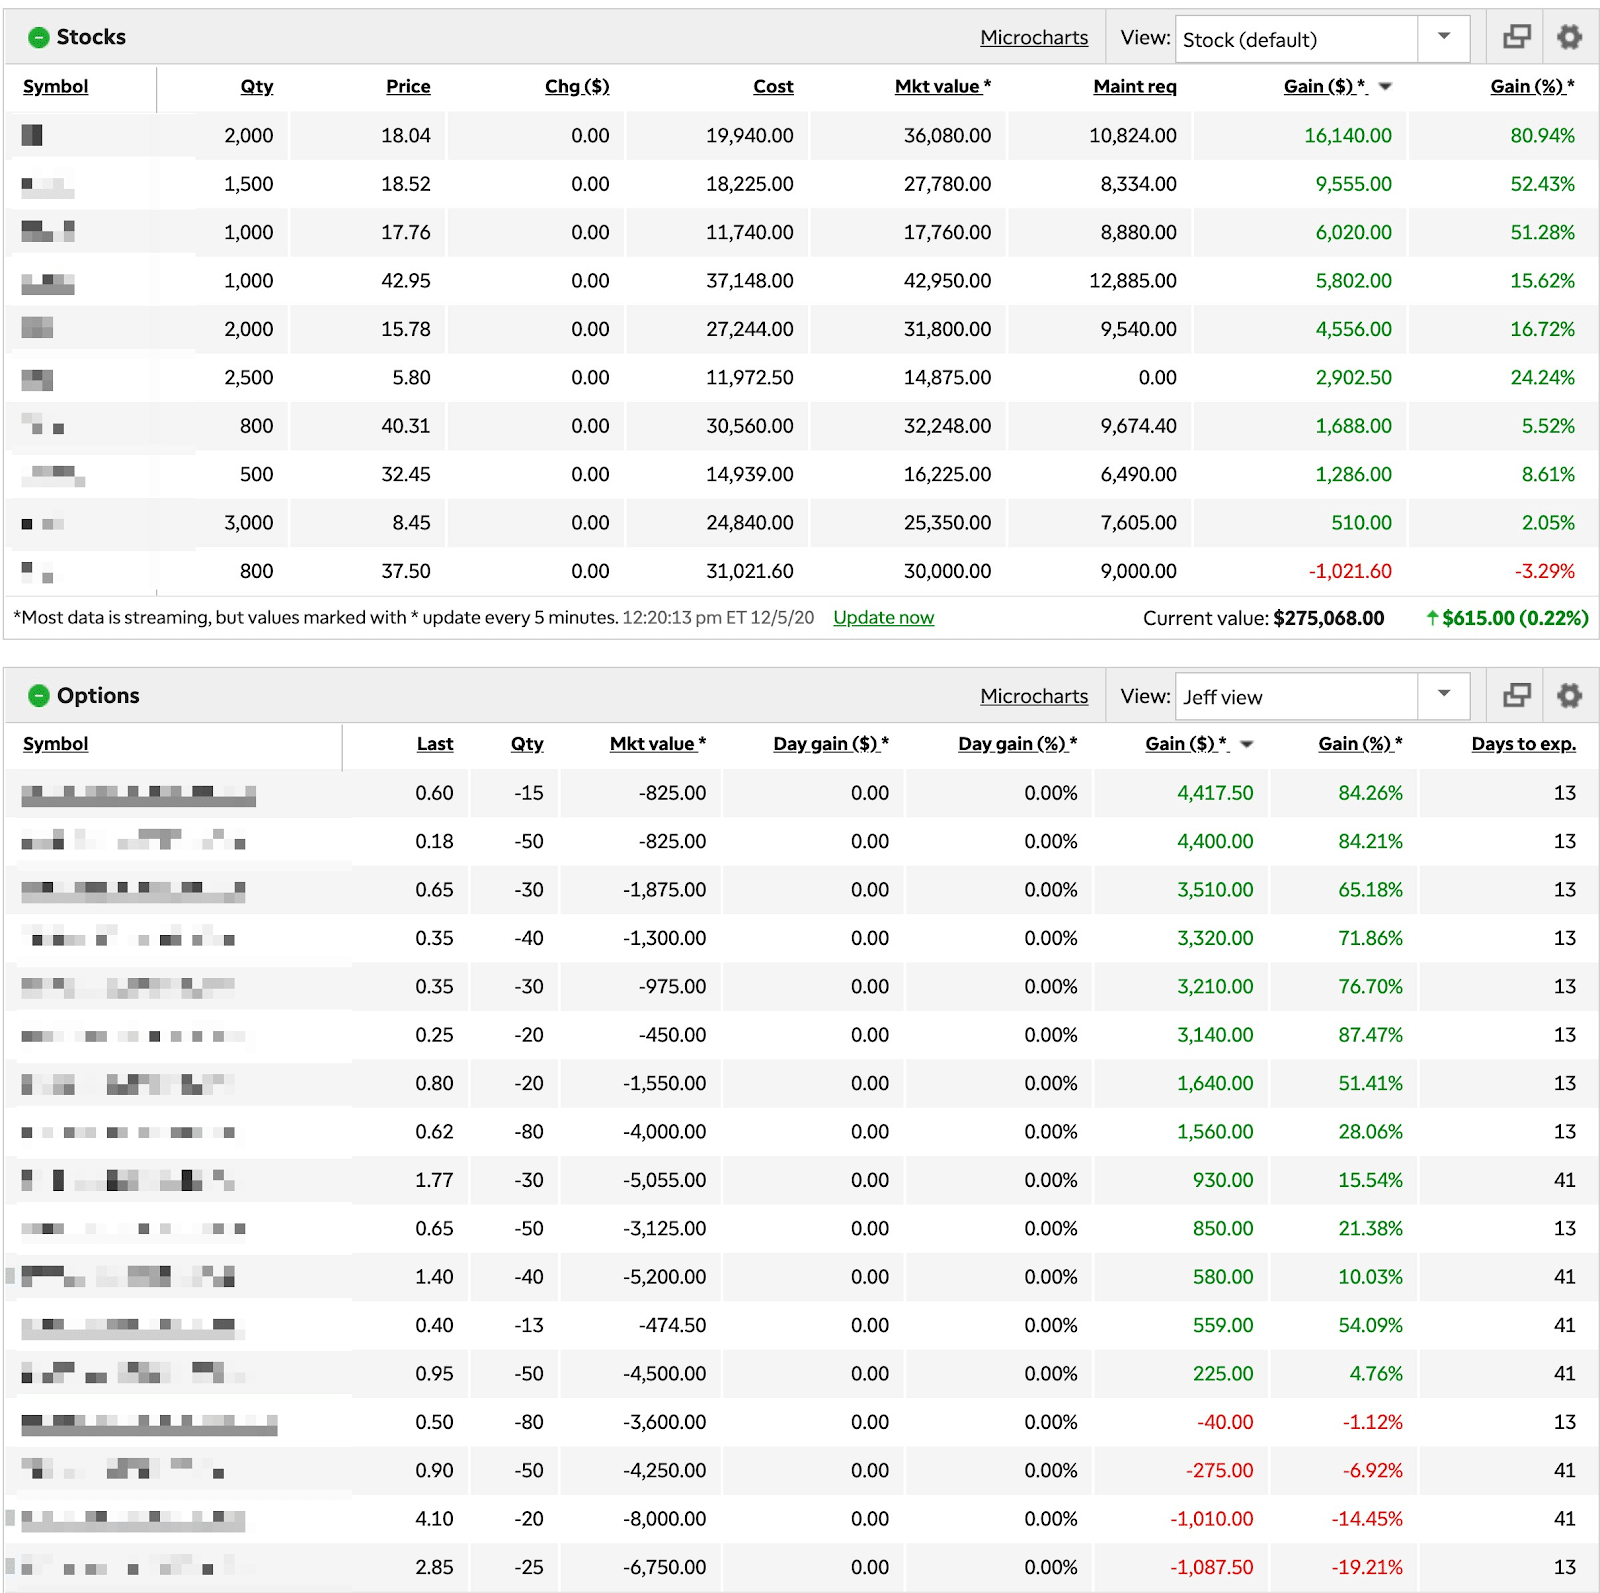
*And that’s before the pullback!
*See disclaimer below
So, you can bet the next set could look even juicier.
That’s why you need to sign up for my Portfolio Accelerator.
And for a limited time, you’ll get a free copy of my SPECIAL REPORT so ACT NOW.
Click here to learn more about my Portfolio Accelerator.
Stocks I’m watching this week
ADBE, SHOP, ETSY, NOW, DOCU, AVLR, HUBS, DPZ, HYLN, CGC, TLRY, MJ, RIOT, WORK, WK, DE, AMZN, SFIX, PINS, IWM, QQQ, SPY, SPWR, JKS, TAN, SPOT, TTD, PENN, DKNG, LI, BABA, ECL
This Week’s Calendar
Monday, December 7th
- Major Earnings: Coupa Software Inc (COUP), HealthEquity Inc (HQY), Stitch Fix Inc Cl A (SFIX), Smartsheet Inc (SMAR), Toll Brothers (TOL).
Tuesday, December 8th
- 7:45 AM EST – ICSC Weekly Retail Sales
- 4:30 PM EST – API Weekly Inventory Data
- Major earnings: Barnes & Noble Ed Inc (BNED), G-III Apparel Grp Ltd (GIII), Block (H&R) (HRB), Thor Indus (THO), Brown-Forman Corp Cl B (BF.B), Chewy Inc (CHWY), Gamestop Corp (GME), Guidewire Software Inc (GWRE), MongoDB Inc (MDB).
Wednesday, December 9th
- 7:00 AM EST – MBA Mortgage Applications Data
- 10:00 AM EST – Wholesale Business Inventories October
- 10:30 AM EST – Weekly DOE Inventory Data
- Major earnings: Campbell Soup (CPB), Designer Brands Inc (DBI), United Natural Foods (UNFI), Veru Inc (VERU), Vera Bradley Inc (VRA), Enzo Biochem (ENZ), Mesa Air Group (MESA), Restoration Hardware (RH).
Thursday, December 10th
- 8:30 AM EST – Weekly Jobless & Continuing Claims
- 8:30 AM EST – Consumer Price Index November
- 10:30 AM EST – Weekly EIA Natural Gas Inventory
- Major earnings: Adobe Inc (ADBE), Ciena Corp (CIEN), Fluor Corp (FLR), Broadcom Inc (AVGO), Costco Wholesale Corp (COST), Lakeland Indus (LAKE), Dave & Busters Entertainment (PLAY), Zedge Inc Cl B (ZDGE).
Friday, December 11th
- 8:30 AM EST – Producer Price Index November
- 10:00 AM EST – University of Michigan Consumer Confidence December
- 1:00 PM EST – Baker Hughes Rig Count
- Major earnings: Big Lots Inc (BIG).
*Results presented are not typical and may vary from person to person. Please see our Testimonials Disclaimer here: https://ragingbull.com/disclaimer
