Stocks and the VIX have a testy relationship.
When stocks fall, the VIX spikes. If the VIX spikes, stocks tend to fall.
But does the VIX trade like any other instrument?
As a matter of fact, it does!
Which is what makes this chart essential for this trading week.
VIX Hourly Chart
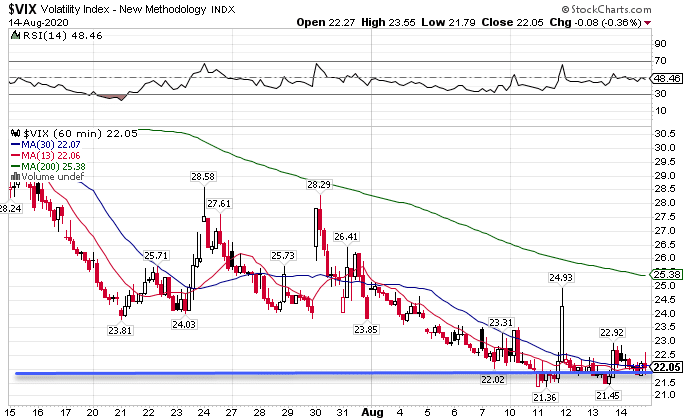
When it crashed earlier this year, the VIX gapped overnight, making a low of $22.
That level continues to hold every day into the close.
Make no mistake – you test support long enough it will break.
And that could lead to a rally of epic proportions.
Don’t take my word for it.
Look at how all the major indexes are primed for a juggernaut of a move.
Consolidation station
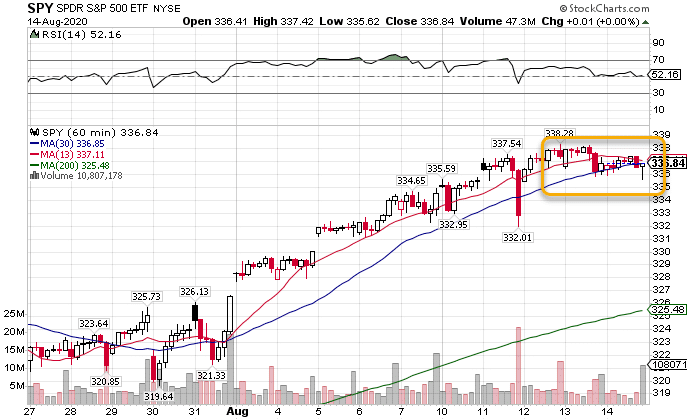
The S&P 500 (SPY) keeps trading in a narrower channel, winding up like a fly wheel, ready to release its energy.
Take a look at the hourly chart and tell me you don’t agree.
SPY Hourly Chart
There’s been a clear consolidation pattern forming here, with the price range contracting.
It’s evident that it wants to make a move soon as it tried on Friday to fall below the 30-period moving average and failed.
That’s a signal the bulls are still in charge.
And I think it’s the energy sector that’ll give it the next push.
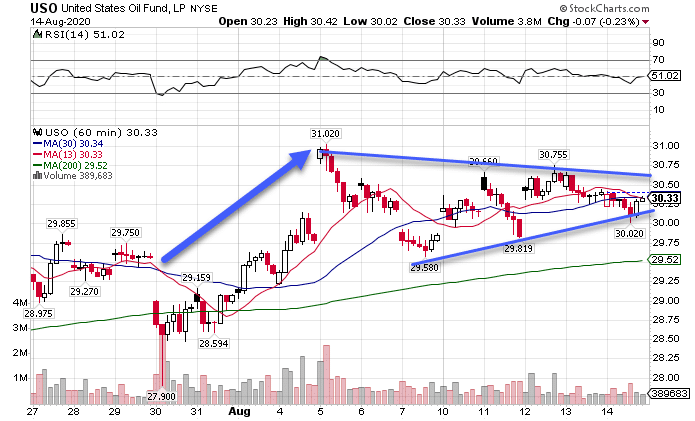
For weeks now, crude oil prices slowly climbed back above $40 a barrel, even as economic data painted an abysmal picture.
USO Hourly Chart
Yet, I can’t help but look at the chart and see a clearly bullish consolidation.
When I connect the tops and bottoms of the candlesticks to create the trendlines, I see a giant wedge pattern forming.
With the last thrust coming from the bulls, I expect them to make the first move here.
Given the high number of energy companies that comprise the S&P 500, that should provide the next boost that takes it to new all-time highs.
But, it’s not just oil that’ll provide the juice.
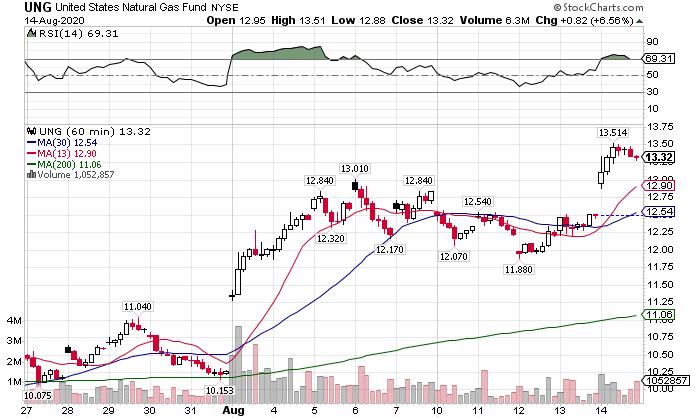
Natural gas tore through the bears the past couple of weeks, jumping over 30% in the blink of an eye.
UNG Hourly Chart
Plagued by constant oversupply, this is the first time this commodity has shown signs of life in months.
Let’s not rely entirely on these pieces to complete the puzzle.
I want to highlight the complete collapse in the safety trade as a real bonus.
Bond beating
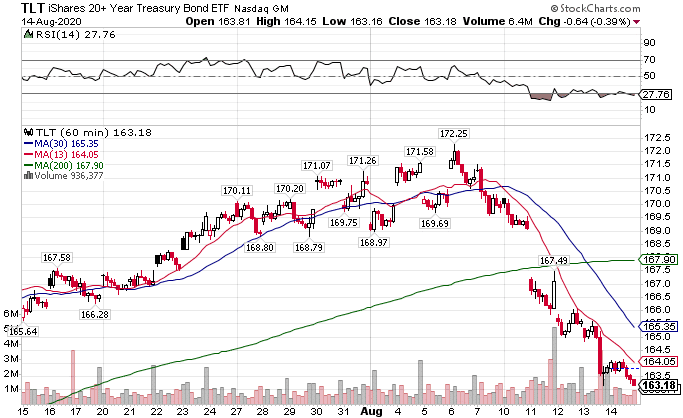
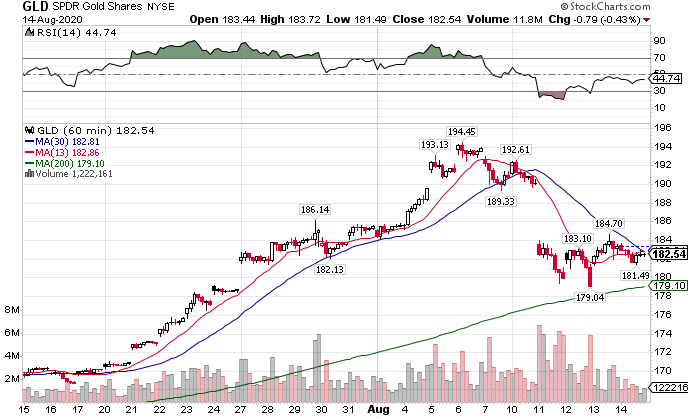
As the Fed slowed down the purchase of assets, both treasuries and gold got annihilated in swift outflows.
TLT Hourly Chart
Just look at how the ETF blew through the 200-period moving average and closed at the dead lows of the week.
That’s not a sign of strength in anyone’s book.
At least gold managed to find some support after it got thrashed.
GLD Hourly Chart
Quickly, I want to point out how the 13-period moving average crossing under the 30-period moving average preceded the decline perfectly.
It provides the basis for many of my High Octane Options trades and proprietary scanner!
What’s particularly interesting is that it didn’t quite make it to the 200-period moving average.
Instead, it came up short and began trading sideways.
I’ll need more information (time) to see whether it’s consolidating for another leg lower or simply taking a break on its epic journey.
Since it’s tended to have a positive correlation with stocks – meaning they trade in the same direction – my best guess is that it heads higher if stocks do as well.
But there is one wildcard among all the charts.
To dollar or not to dollar
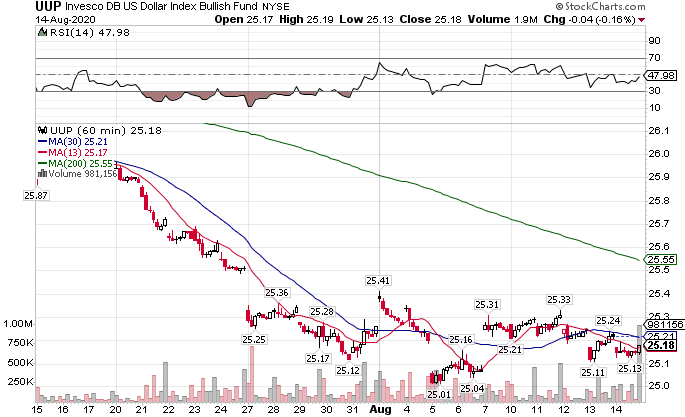
With everything commodities to metals priced in U.S. dollars, a falling dollar benefits them as well as assets including real estate and stocks.
Right now, the dollar is hovering at a support level, trying to decide on its next move.
UUP Hourly Chart
So far, the dollar’s rapid decline fueled the rally in stocks like Caterpillar (CAT) and industrials (XLI) who benefit from a cheaper greenback.
Putting the pieces together
Taken all together, this paints a story for higher prices that could create a MASSIVE melt-up.
First, a close below $22 in the VIX could force volatility traders to stop out of positions, sending volatility lower.
Second, the dollar teeters on the edge of breaking down to new lows.
And finally, all the equities markets are wound tighter than a toddler on a sugar high stuck in a high chair.
That’s why I’ll be positioning myself in some key options trades this coming week.
High Octane Options members will get an inside look at what I’m thinking with my portfolio and trades streamed live.
That includes my trade ideas each morning and expectations for upcoming market action.
All this is waiting for you as well.
