After weeks of watching tech and gold scream higher, both hit the pause button.
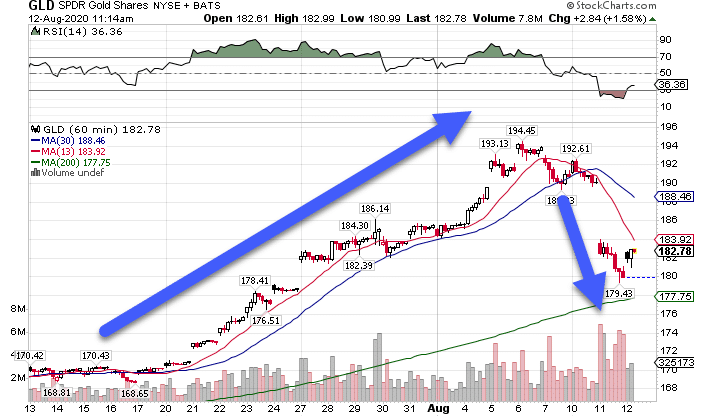
Actually, gold did more than hit the pause button.
GLD Hourly Chart
What’s so cool about this chart, and what I want to discuss today, is how the money-pattern preceded the move lower.
No, I didn’t catch this massive decline.
But I did snag some puts on the QQQ of the same indicator to pick up some healthy profits.
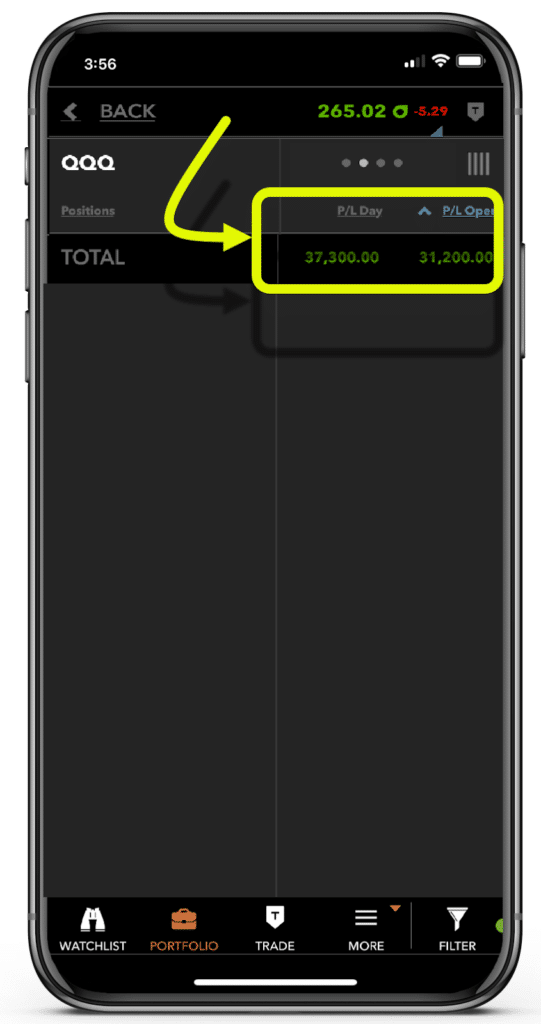
A quick but efficient trade in my Total Alpha Portfolio*
*See disclaimer below
To be fair, it took me a few shots to get this trade right, so I had a couple of other losers the past few weeks.
But none had the money-pattern crossover, and a failure on my part to stick with my strategy.
So, let’s walk through how this money-pattern played out, looking at the mechanics of the chart as well as the broader context.
Because let’s face it – no trade occurs in isolation.
Anatomy of the money pattern
The money pattern isn’t some hidden secret I unearthed from a buried tomb. Nor is it something I pulled off some Wall-Street titan.
It’s all my own, but a great tool.
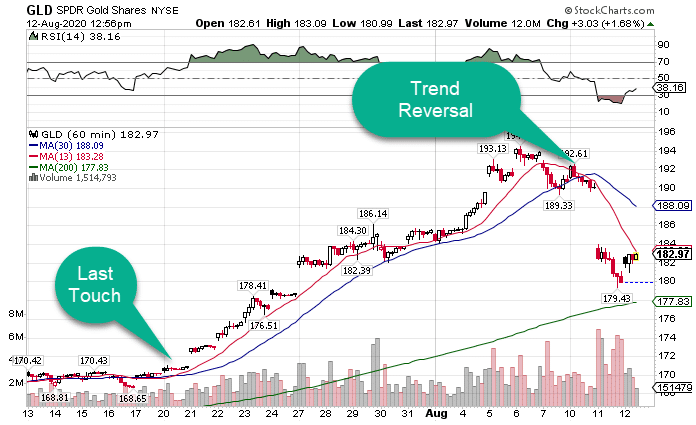
The pattern is a simple crossover between the 13 and 30-period moving average on the hourly chart.
And it tells me when there’s a potential trend change.
There’s a couple of rules that go along with it.
- I want there to be 50-75 bars (candlesticks) since the last time the two moving averages crossed.
- It should be reversing a pretty well-established trend.
Here’s how it looks on GLD.
GLD Hourly Chart
Like Tesla weeks before, GLD made a parabolic move, soaring higher and higher in what most of us would call an unsustainable fashion.
The problem is getting in front of that train can be devastating. GLD could easily have gone another $10, $20, or $30.
So, you need something that says things are slowing down as well as somewhere to trade against.
That’s where the money pattern comes in.
The crossover uses a fast and slow moving average, with the faster one more sensitive to price changes.
When it crosses the slower moving average, that tells me price changed direction dramatically enough in terms of time and price to change its trend.
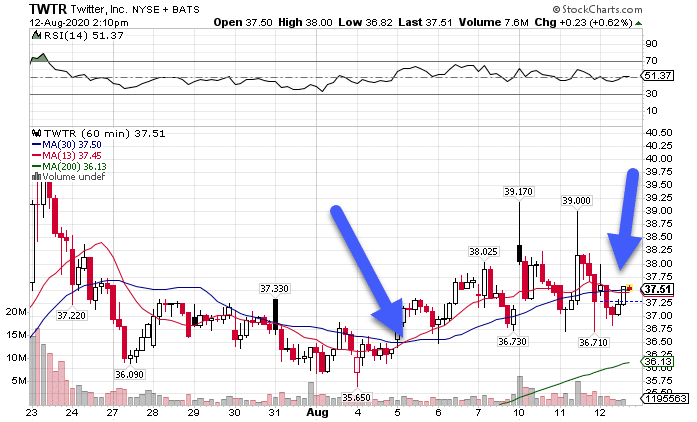
TWTR is an example where there is a crossover, but it doesn’t reverse a trend.
TWTR Hourly Chart
Notice how they really didn’t get much separation at any point. This can happen, which is why I don’t rely on the indicator alone.
Creating the QQQ trade
Let’s take a look at the QQQ chart and see how this trade set up.
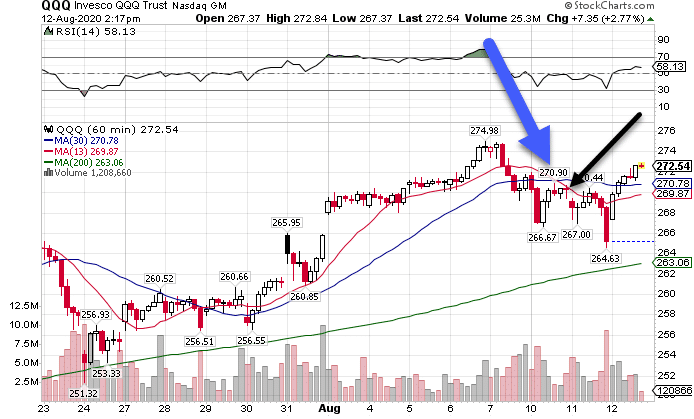
QQQ Hourly Chart
Before the crossover, shares made a peak and rolled over on a Friday. That wasn’t a signal by itself, but it was a clue.
Next, price dropped below both of the moving averages, something it hadn’t done since late July. At a minimum, that told me the perpetual upward move was taking a pause.
That’s when the crossover occurred.
Now, that came towards the end of the day as price ran right into it. So, I had to anticipate it a little bit.
How would do you do that?
Well, I keep a list of stocks and indexes that I look at pretty regularly, maybe 20-40 names.
When you start seeing the moving averages turn, especially on stiff price action as we saw here, you can keep an extra eye on it.
Typically, when the crossover happens, price is much lower than the moving averages. So, I look for a retracement into them to go short (or long).
With this setup, it was pretty straightforward.
I went short (bet against the QQQ) by buying QQQ puts.
Since I was using the hourly chart, I took ones that expired that Friday. My expectation was the market would fall apart quickly if it was going to.
I came to this opinion using the RSI above the chart which told me that the market was severely overbought.
As the market fell, I scaled out of the trade, taking profits along the way. For as much as I like to think I know where the move will end, it often runs farther than I expect.
So, I want to leave a little on to squeeze as much juice out as possible. It’s like dollar-cost averaging for training.
Learning to select the right options contract
I know it can be tough as an options trader figuring out which options contract to choose.
Grab the wrong one, and a good idea can turn into a lousy trade.
That’s why one of my core lessons in my Total Alpha Options Masterclass addresses this for you.
Learn how I analyze option contracts and decide on the best one for the trade.
Click here to sign up for my Total Alpha Options Masterclass.
*Results presented are not typical and may vary from person to person. Please see our Testimonials Disclaimer here: https://ragingbull.com/disclaimer
