I could state the obvious – the market made another all-time high. It would be easy for me to point out the QQQs are up nearly 10% after running almost 45% in 2019.
But none of that would help you navigate the markets.
No… you need something better… something that helps you pull your head out of the sand.
 Don’t let the talking heads on television and financial news fool you!
So how about I shed some light on a few areas you missed… ones that provide clues to where the market goes next?
Plus we’ll go over some juicy trades to boot.
Where are the financials?
Any value investor…heck anyone investor worth their salt knows that a bull market without the financials isn’t sustainable.
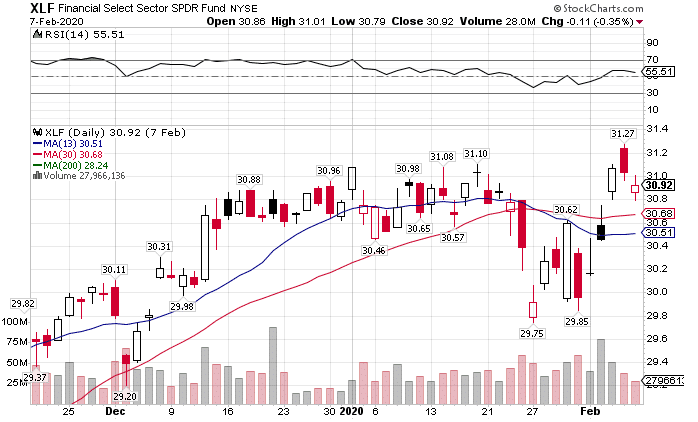
XLF Daily Chart
When these companies reported earnings to start the quarter, they noted the easy Fed money hurt their bottom line. Banks rely on the net interest margin for a huge chunk of profits. That cash comes from the spread between the rate they borrow and the rate they lend. When the Fed drops rates, that compresses the margins.
That’s led banks to get creative in their search for earnings. While refinancing tends to pick up, overall lending continues to be hampered by a housing shortage along with low loan demand. When many of these institutions dropped their trading commissions, it took another leg from under them.
All of these could be seen as a one-off or transitory events. But the fact remains that financial institutions remain the backbone of the global economy. And so far, they can’t seem to find their footing.
Did everyone forget about the coronavirus?
Traders must be experiencing a bout with dementia. A few weeks ago when the coronavirus broke out, everyone predicted doom and gloom. Now with a higher death toll than SARS and no end in sight, equities shrugged off any concerns.
Let’s take a moment to consider all that’s transpired. A couple of weeks ago you had 10,000 people infected with around 300 dead. You know have 45,000 cases worldwide with over 1,100 dead.
This leads me to one of two conclusions. First, the market cares nothing for news. Day to day that may be true, but long-term issues do tend to hit it. Second, momentum keeps the market moving forward. Once that river gets redirected, we’re in for a world of hurt.
Guess who isn’t at all-time highs?
With the focus on large-cap names, no one seems to notice that the lonely Russell 2000 still hasn’t made new all-time highs. Yes, it broke out of the multi-month trading range that held it back for most of 2019. Yet, it can’t seem to get that last push over the old highs.
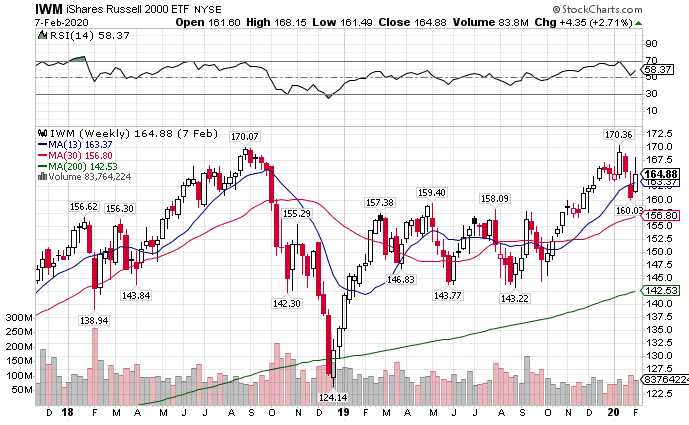
IWM Weekly Chart
Not to be outdone, the transportation sector continues to fail to get any traction. Dow Theory would dictate that a sustainable market rally requires transports. If that’s the case, we haven’t had a sustainable rally since mid-2019. It’s fascinating given the low crude input costs that should pad the profits of many of these companies.
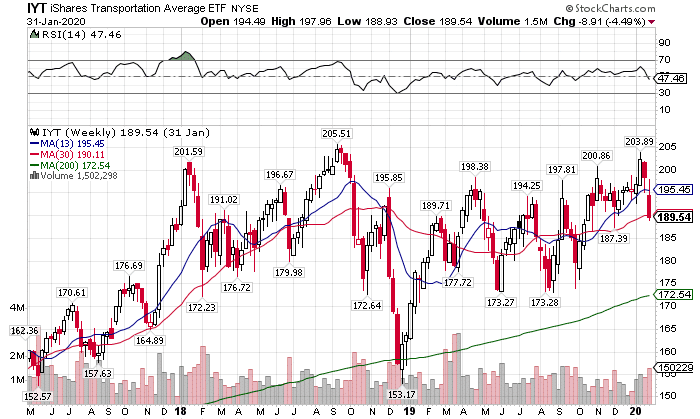
IYT Weekly Chart
The safety trade isn’t over by any stretch
Here’s where you need to sit up and pay attention. Investors hide their money in gold, bonds, and the U.S. dollar when they fear a recession. ALL of these markets are near record highs along with equities (or at least relative highs).
What happens if they all fall off at the same time? That’s something you don’t want to see. You effectively have nowhere to hide your money.
Nonetheless, with the Fed’s foot on the pedal, it’s unlikely we’ll see bonds come off their record highs anytime soon. And if anything, gold looks primed to take out and make new highs in the next few months.
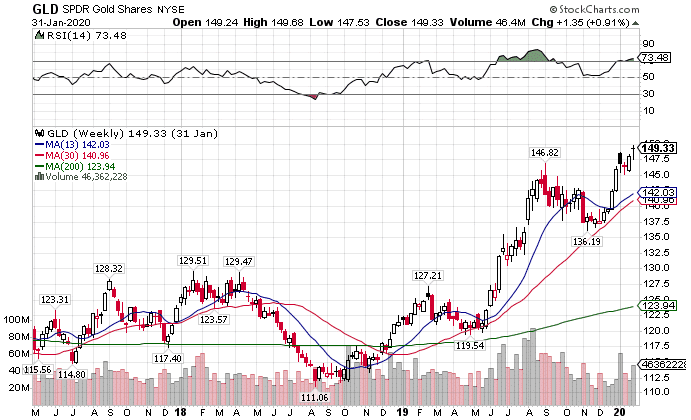
GLD Weekly Chart
One of the most consistent performers week in and week out has to be utilities (XLU). As bond prices rise, investors like to buy utility stocks for their yield. Normally low-volatility stocks, utilities jumped over 22% in 2019, and are already up over 7% for 2020.
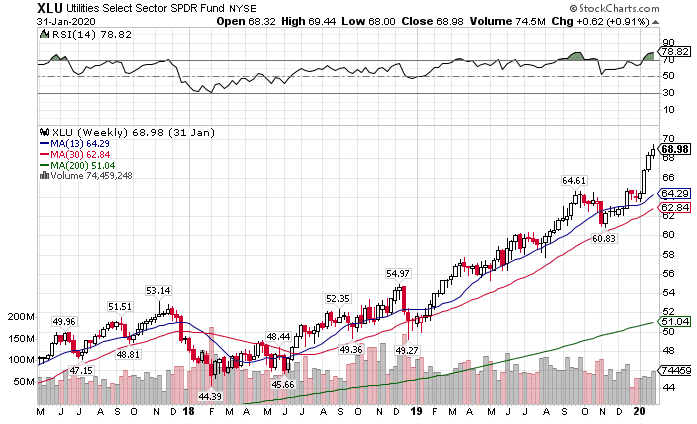
XLU Weekly Chart
So where’s the next stop on this merry-go-round?
While it looked like last month would mark a top, we’ve already blown through the highs on the major indexes. The next stop is the big round $340 on the SPY. Markets like to go for those spots before ultimately finding tops and bottoms.
With the VIX imploding for the last week, it’s back below the 200-period moving average on the daily and weekly charts. Chances are we’ll see it in the $12 range before $15.
Now, the one curveball could be the elections. Markets hate uncertainty. With Joe Biden looking less like the front-runner every day, a possible Democratic nomination of a more liberal candidate like Elizabeth Warren or Bernie Sanders might not be received well considering their stance on Wall-Street.
