We made it through 2019, ending one of the best decade runs in history.
With the QQQ finishing up almost 40%, it still baffles me how the average hedge fund returned a pathetic 8.5% for the year.
Where they even trading the same market?
This midweek market update takes a more expansive view than normal.
We look to the past for guidance, as well as, laser in on what the charts are telling us now about the stock market.
A disagreement between short-term and long-term charts
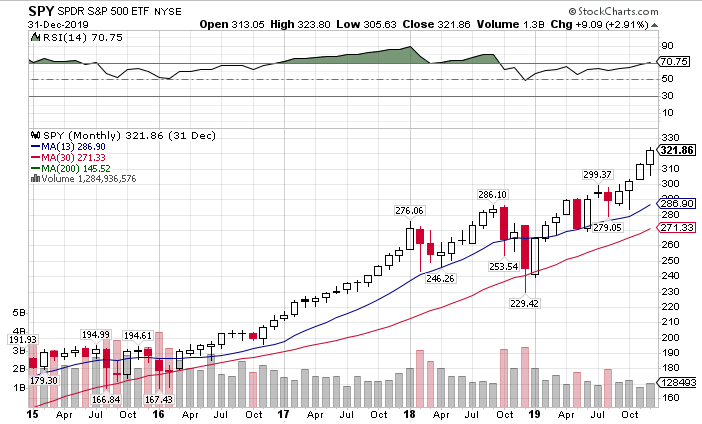
No one would look at the following SPY monthly chart and dispute its bullish trend.
SPY monthly chart
Even with the modest pullback to end the month, December finished near the highs, which closed the year in the same spot.
Markets look more like they want to ramp up rather than down.
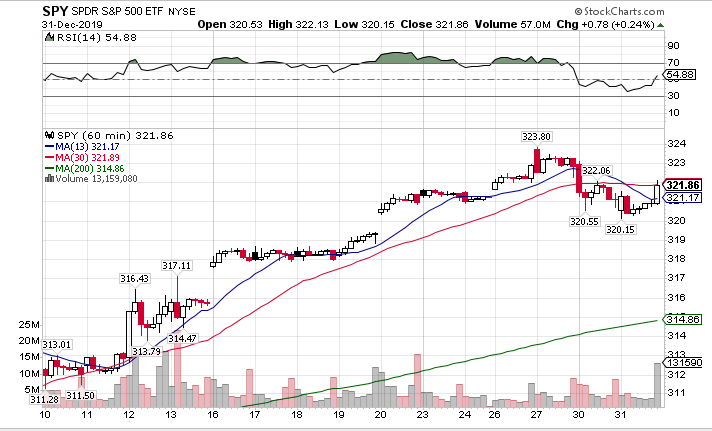
Yet, the intraday picture says things might need a pause before that happens.
Look down at the hourly chart and you see an ominous crossover of the 13-period and 30-period moving average.
SPY hourly chart
This is actually a great example of a setup to go short. I like using the high of $323.80 as my stop, with a target somewhere around $315. That aligns nicely with the 200-period moving average and creates a solid risk/reward.
Long the IWM short the SPY
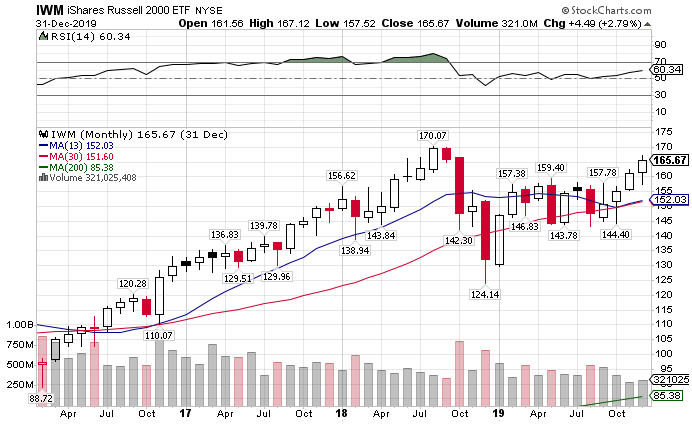
I’m not a big one for pairs trades. But, the SPY is overextended starting the year. However, the IWM looks much healthier.
IWM monthly chart
Small caps have room to run before they take out the all-time highs. That gives them a better chance of receiving rotational support.
So, when I want to balance the trades across my portfolio, I short the SPY to reduce my long bias, or I buy the IWM to increase my bias. That hedges my risk while playing an underlying trade idea.
Gold could perform for years to come
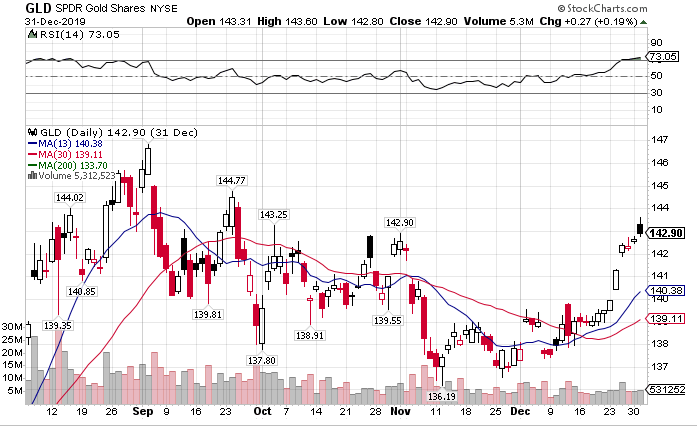
Many traders thought the gold run over at the beginning of December. With stocks hitting new highs every day, gold sold off as traders poured money into equities.
GLD daily chart
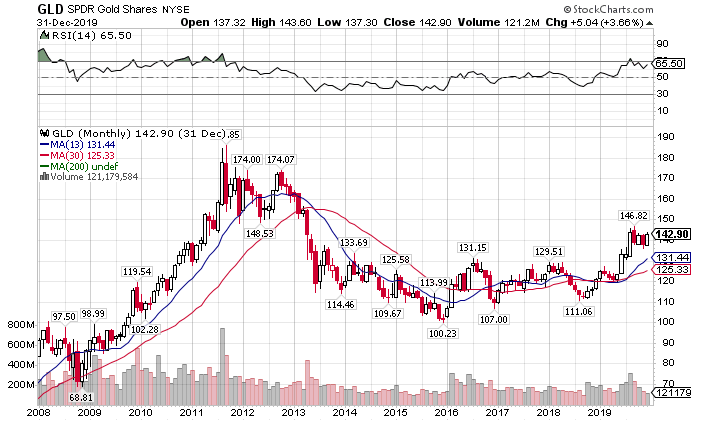
Yet as we all headed home for the holidays, gold found its footing and then some. When I look at the monthly chart, I see a commodity that’s getting ready to run higher.
GLD monthly chart
Gold ran higher through 2019 and then consolidated for the last few months. Despite the rally in equities, it never got hammered. Finishing the year near its highs puts the previous all-time highs into view. That’s saying something given that’s almost 30% higher from here.
The great bond dilemma
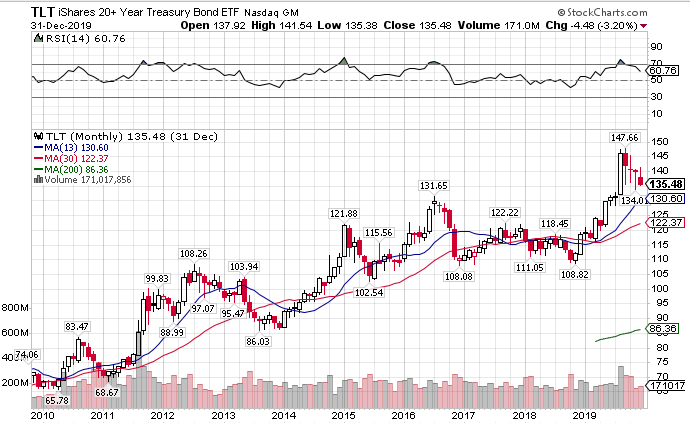
I don’t expect bonds to do a lot to start the year. But we could see a hard sell-off pretty soon. With equities looking to burst higher, bonds are poised to trade much lower.
TLT monthly chart
After one month of a ridiculous run, bonds keep sliding lower and lower rather than hold the upper range like gold. This leads me to believe the TLT wants to slide all the way down to $110, about 20% lower.
This could pose a problem for central banks who keep trying to maintain low rates. Some things might just be out of their control – this being one of them.
Energy will be the next leg in the market
For years crude oil has been in the duldrums. S&P 500 earnings would have been positive in Q3 had it not been for the energy sector.
Yet, the fundamentals might be shifting. Banks are reducing lending to frackers as their production isn’t meeting forecasts. That’s cut back on supply, which is starting to leak into price.
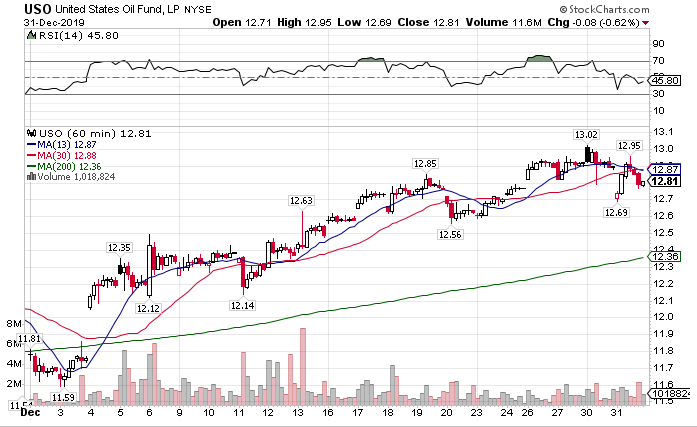
We saw a pretty remarkable run in crude oil through the month of December.
USO hourly chart
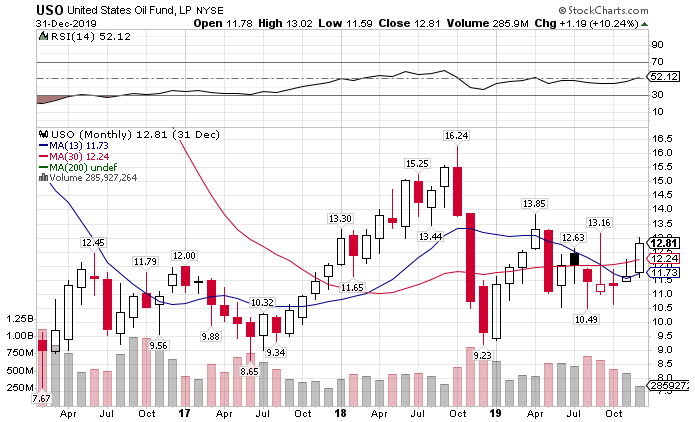
While there could be a short pullback, the monthly chart seems like it wants to move higher.
USO monthly chart
A run to the highs we saw in 2018 could fuel the next leg in the market that pushes things up into the ludicrous realm.
Keep a close eye on the dollar
One trade that I rarely play, but looks delicious is the dollar. The UUP ETF ran into the 200-period moving average on the daily chart.
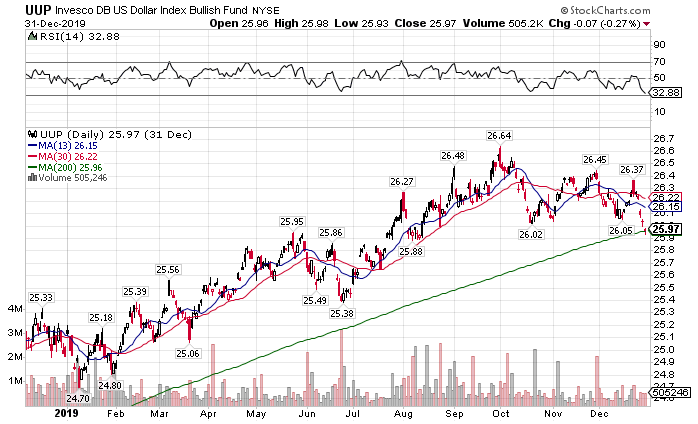
UUP daily chart
That’s also a fine area of support that could lead to a multi-week rally. While I don’t want to be permanently long the dollar, I wouldn’t mind selling a put credit spread or picking up a few call options.
2020 Plan – Create More Consistent Income
Starting in 2020 I plan to add new strategies to my portfolio that aim to achieve a 90% win-rate! I want to create consistent paychecks that I cash out every week.
You can get in on the action by joining Total Alpha.
