Massive trades are within reach, you just have to know where to look to find them.
I mean who doesn’t love the market right now?
Every single trading day, there are multiple opportunities to make money… and I expect there to be even more money makers as we cap of 2020 and head into the new year.
Heck, even Jason Bond thinks 2021 could be his BEST TRADING YEAR EVER!
Opportunities abound from electric vehicle stocks to biotech.
Why stare with envy at the success of others when you can snatch your own?
That’s why I want to dissect my recent winner with GWPH – to show you IT IS POSSIBLE!
Combining a strategic chart pattern with a hot storyline, the calls I picked up soared within days.*
![]()

*10x gain using chart analysis
*See Disclaimer below
You can follow the same analysis steps to discover setups you never thought possible.
And here’s how to start…
Did you know…
GW Pharmaceuticals isn’t just any old biotech company.
No, no, no.
Unlike traditional pharmaceutical companies, GW focuses on using cannabinoids in their concoctions.
And if you didn’t know, I’m extremely bullish on this sector now and into the future.
It’s only a matter of time before legalization occurs, so I want to be ahead of the curve where I can.
The setup
Now that you know the storyline behind my thinking, let’s take a quick look at the chart.
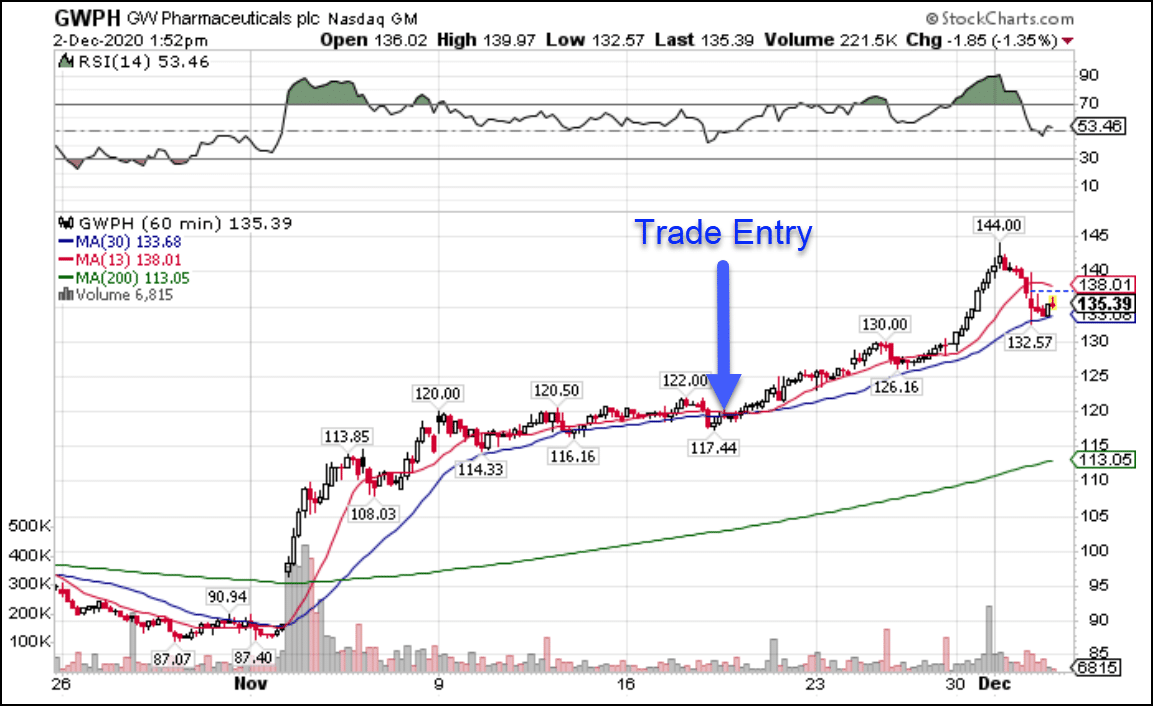
GWPH Hourly Chart
The first thing that should pop out at you is the gap higher in early November. That came after the company reported earnings including FDA approval for one of their treatments.
Shares surged on heavy volume, driving from $90 a share to $110 in a few days.
It was at that time that I started to take notice.
Let me quickly talk about option prices.
Right before earnings, option prices increase as implied volatility increases. Think of implied volatility as option demand.
Traders and investors buy options to protect themselves against the earnings reactions, which can be significant.
As demand for the options increases, so do the premiums (cost of the options).
Once a company announces earnings, the implied volatility contracts.
So, by waiting until weeks later when things calmed down, I bought call options that were cheaper, all things being equal.
Now, let’s take a deeper look at the setup.
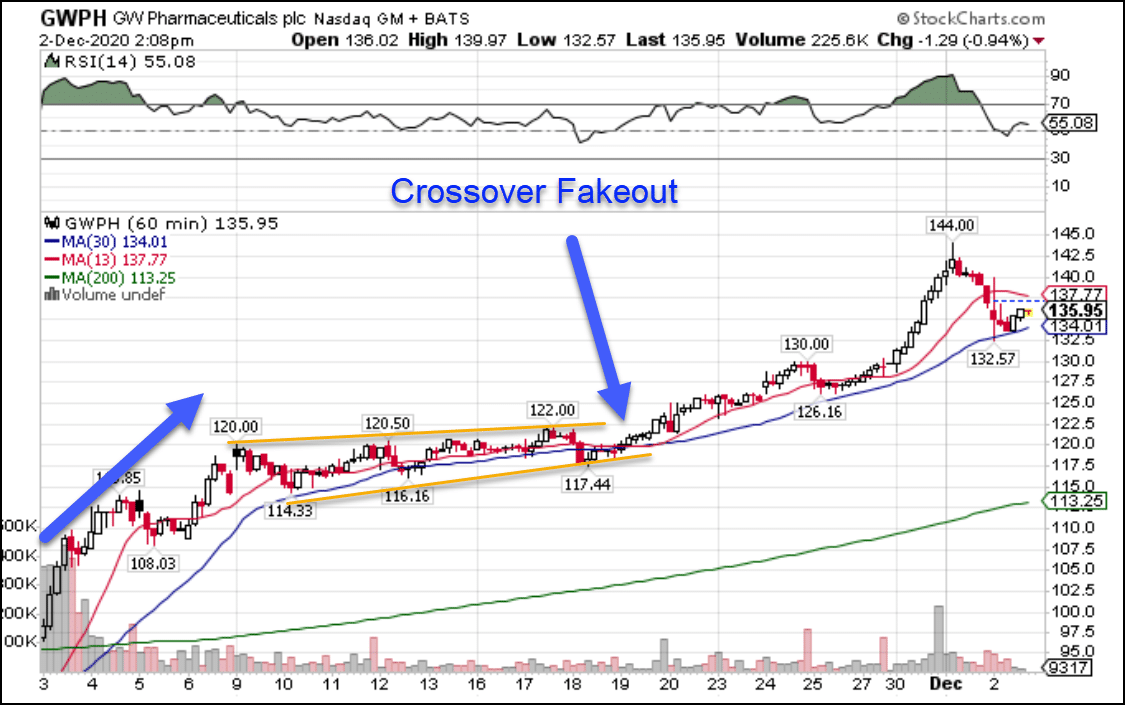
GWPH Hourly Chart
The drawing above is called a consolidation pattern.
Consolidation patterns act like rest areas for price to move sideways before the next move higher. That is where I want to enter trades – before the next move.
The initial thrust from earnings started the upward trend and formed the beginning of this pattern.
From there, I drew orange trendlines that connect the highs and lows of the candlesticks.
In a consolidation pattern, these trendlines should run parallel or converge on one another. You do not want to see them separating.
A narrowing price channel highlights bulls and bears jockeying for position. Once they meet in the middle, someone has to win out. More often than not, it’s the side in favor of the current trend.
I want you to notice how the stock made a series of higher highs and higher lows. That says each time a selloff occurred, buyers stepped in earlier and earlier. Similarly, every time the stock peaked, sellers took longer and longer to step in.
All of this suggests extremely bullish price action.
Lastly, I saw a crossover fakeout. When the moving averages glance but fail to crossover, that often precedes the next leg higher.
Risk/Reward
Here’s how I turned this trade into a monster.
With a narrow price channel, I used a stop nearby, around $117.
At the time I bought call options, shares were trading around $120. So, I had $3 in downside.
The potential upside in this trade turned out to be enormous.
Do they always work out this way?
Not at all.
But, even if I only got $130 as an upside target, I’m risking $3 to make $7 (ignoring changes in option prices for the moment).
The actual upside was $24, or 8 to 1 reward to risk.
And that’s where call options came to play.
Call options use leverage, allowing me to put up a fraction of the capital to control more shares than I could otherwise.
The total amount I could lose on the trade was what I put in, or around $5,000. But as you can see, the exponential potential was extraordinary.
Start with one idea
Traders struggle for years to turn a profit.
I know, I was there.
You don’t need to master every idea and pattern out there.
It just takes one.
That’s why you need to attend my upcoming seminar.
Learn my favorite pattern I use to trade the markets – one you can apply today.
Click here to register for my upcoming seminar.
*Results presented are not typical and may vary from person to person. Please see our Testimonials Disclaimer here: https://ragingbull.com/disclaimer
