Stocks are popping off to kick off December — could this be a sign of what’s to come later this month?
We’ll have to wait and see. However, this end of year rally is real, in my opinion.
You see, I like to look at the numbers… and what the stats are telling me right now is the so-called Santa Claus Rally is real.
However, it doesn’t work the way you might think it does.
Working with the top researchers and some of the brightest minds here at RagingBull, we crunched stats to uncover this trade idea.
And when I heard the results can help me make money, I just had to tell you about it.
I want to walk you through the stats because a quick glance might give you the wrong idea.
In fact, it makes a great case for trading options over stocks.
You’re probably thinking, “Pfft, show me when following the stats has helped you make money, and I’ll read what you have to say…”
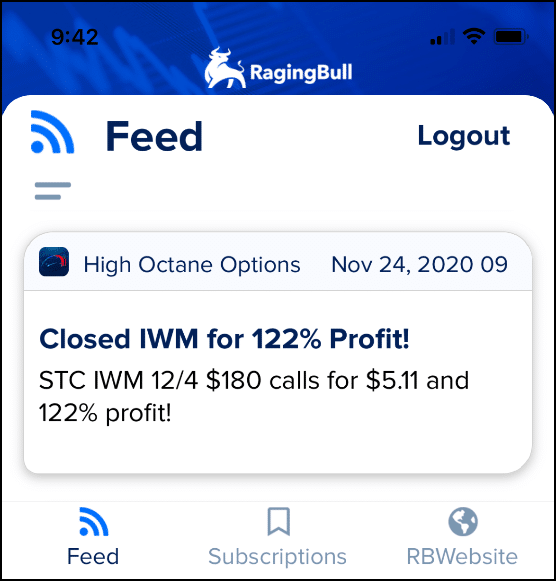
In November, I turned stats into High Octane trade idea the Friday before Thanksgiving…*
*The results speak for themselves.
*See disclaimer below
And I see an opportunity to do it again.
So let’s get to the data!
Santa?
Traders pass along many sayings. One of the most popular – the Santa Claus rally.
Oddly enough, no one really ever defines the trade.
No one except for ME!
The phenomenon is a bit odd considering that December isn’t such a bullish month historically.
In fact, if you bought the open of December and sold the close, for the last 20 years, your outcome would look something like this:
- SPY – 63% win-rate, 0.71 profit factor
- QQQ – 52.6% win-rate, 0.57profit factor
- IWM – 63% win-rate, 0.84 profit factor
- DIA – 63% win-rate, 0.94 profit factor
- TLT- 55.56% win-rate, 1.79 profit factor
As a quick reminder, here are some definitions.
Win-rate = total wins / total trades
Profit factor = total profits / total losses (where total losses are a positive number)
Profit factors less than 1 lose money overall, equals 1 is breakeven, and greater than 1 makes a profit.
Overall, December seems to be a nice win-rate month. But the profit factors are quite low.
In fact, we see the same thing with the Santa Claus rally.
If you buy the open of the Friday before Christmas and sell the close of the last trading day before Christmas, it would come out like this:
- SPY – 73% win-rate, 0.68 profit factor
- QQQ – 68.42% win-rate, 0.39 profit factor
- IWM – 73.68% win-rate, 1.09 profit factor
- DIA – 73.68% win-rate, 0.60 profit factor
- TLT- 44.44% win-rate, 0.46 profit factor
Seems kind of odd that the win-rates would be so high but the profit factors so low.
Why is that?
To answer this question, we need to turn back the clock to 2018.
2018 Data Skew
Back in 2018, markets hummed along until the Fed decided they wanted to end the party.
Raising rates to end the year, markets threw a tantrum. And why not, much of the gains came from the Fed easy money policy.
December fell so much that it changed the profit factor for the Santa Claus trade and the monthly statistics for the last 20 years.
If you removed 2018 from the stats, here’s what you’d get:
Month of December:
- SPY – 66.67% win-rate, 1.94 profit factor
- QQQ – 55.56% win-rate, 0.39 profit factor
- IWM – 66.67% win-rate, 2.15 profit factor
- DIA – 66.67% win-rate, 2.75 profit factor
- TLT- 52.94% win-rate, 1.46 profit factor
Santa Claus Rally:
- SPY – 77.78% win-rate, 4.46 profit factor
- QQQ – 72.22% win-rate, 2.50 profit factor
- IWM – 77.78% win-rate, 4.59 profit factor
- DIA – 77.78% win-rate, 4.52 profit factor
- TLT- 41.18% win-rate, 0.28 profit factor
Why did 2018 create such an outsized impact?
Because we’re only looking at 20 years of data here. So, we don’t have too many data points to look at.
And because the selloff was so large, it was enough to bring everything else down.
With small sets of data like this, it’s important to really understand what you’re looking at. Otherwise, you come to the wrong conclusions.
Creating a Trade
With these statistics, you can your own trade setup.
Add a chart pattern like the one I teach in my upcoming seminar, and you have a true trading weapon.
When you apply independent ideas like seasonality and a chart pattern, you create trades with unbelievable potential.
That’s why you don’t want to miss out on my upcoming seminar.
I’ll teach you my favorite chart pattern today.

