Last week, everyone thought BTC would hit new all-time highs…
In just a matter of days, BTC got decimated and all the weak hands got shaken out.
Right now, BTC is popping off and actually made new all-time highs and all those traders who puked their holdings are probably kicking themselves.
But listen, all of these moves are telegraphed.
Even if you missed out on the moves in BTC or stocks related to digital assets… you shouldn’t beat yourself up.
I want to show you how to time these moves —whether you’re a day trader or looking for the next swing, I’ve got you covered.
Because one thing is painfully obvious – A HUGE MOVE IS COMING!
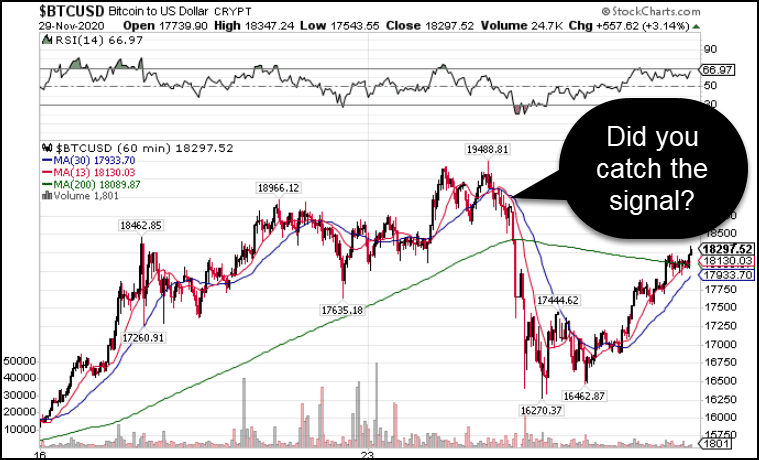
BTC Hourly Chart
And now there are several more flashing across the screen.
Let’s go over them so you can beat the buzzer.
Why Bitcoin Crashed
The all-time high for Bitcoin came in December 2017 at $19,707.
How is it possible to stop just shy at $19,496.98?
Fun fact you probably didn’t know – 2% of Bitcoin accounts control 95% of all the coins.
That’s more concentrated leverage than almost any other market.
So, when one of those Buffett of Bitcoins decides to unload, there isn’t much stopping price declines.
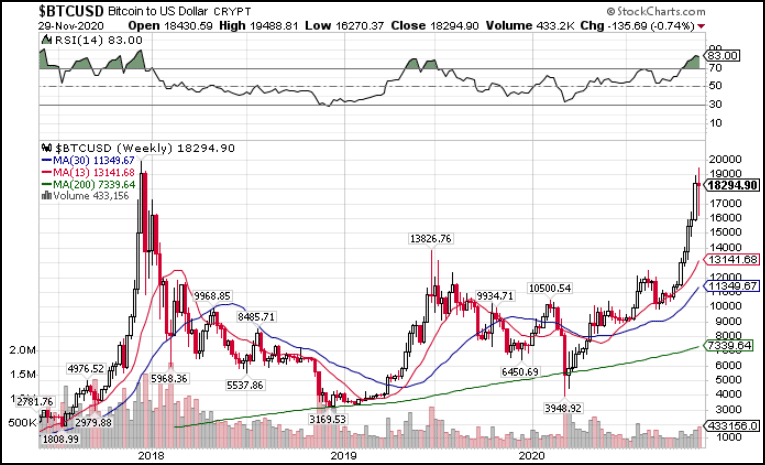
Bitcoin Weekly Chart
And let’s face it, this parabolic move wasn’t sustainable.
We already saw coin prices climb unabated through most of 2017. So it’s not much of a surprise that a more mature market would stop earlier.
And based on the look of this chart, we won’t break higher anytime soon.
Take a look closer look at the weekly chart here.
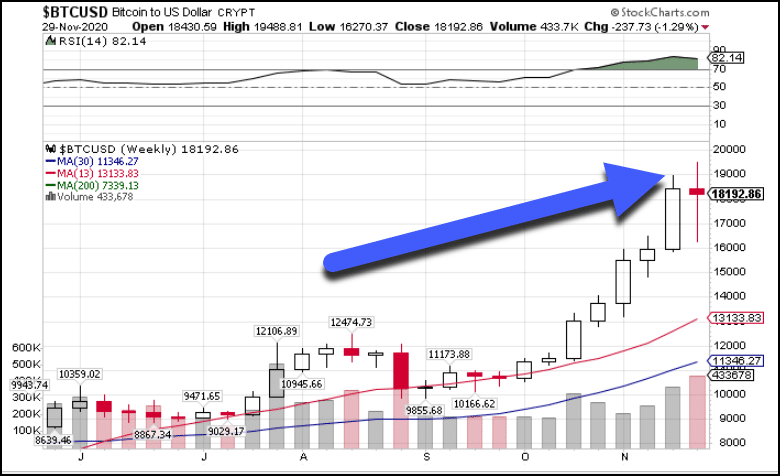
Bitcoin Weekly Chart
My friends, this is what’s known as a doji candle. When they appear at highs and lows of charts it often marks a turning point.
When they come on high volume it’s even better.
A pullback or at least a pause makes all the sense in the world here.
Price nearly doubled in a matter of months as if it were a new IPO.
Since we’re looking at a weekly chart, the high of this candle could hold for a few weeks. However, since we’re likely to close the month near the highs, I expect we’ll start to break above sometime in late December or January.
And here’s why.
Short-Term Outlook
If you haven’t attended my Crashing Stocks webinar (which doesn’t cost a dime), then this next part might get past you.
Take a look at the hourly chart here for Bitcoin.
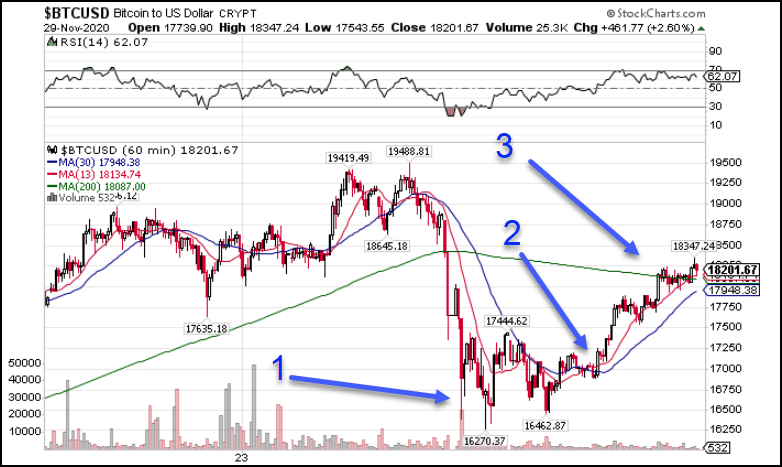
Bitcoin Hourly Chart
I noted three different inflection points that provide clues to the next moves.
The first one hints at a triple bottom.
You can see how the candlestick wicks piked down to around $16,500 three separate times. The first one came on a spike in volume.
A pattern like this forms the basis of a reversal.
At the second point, we find the Crashing Stocks pattern, but in reverse!
It precedes the move higher, which follows in a series of bullish formations.
Which leads me to point three.
This is a classic bull flag formation right on top of the 200-period moving average.
And my spidey sense tells me price is heading higher.
You see, the 200-period moving average is by far the most useful indicator in my trading.
It acts as a magnant, support, and resistance.
In this case, because price hit the indicator and simply traded sideways, I know there’s buying pressure underneath. Otherwise, it would have reversed lower.
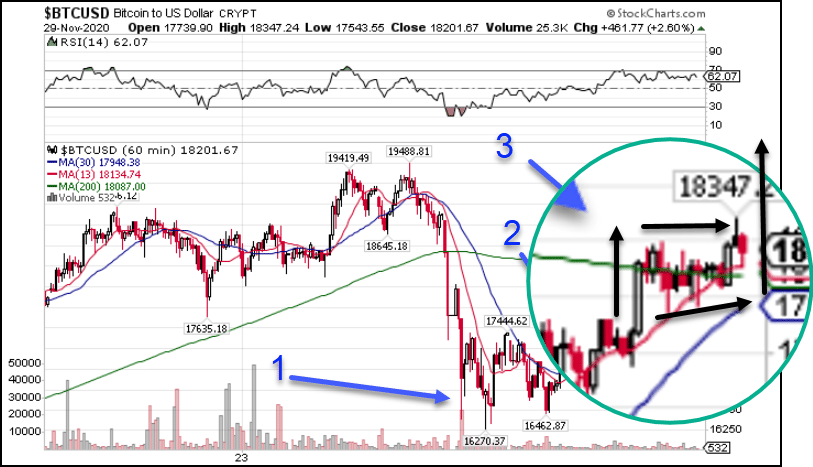
Bitcoin Hourly Chart
How high will it go you ask?
Most likely in and around $18,700, give or take $300 on either side.
That puts it back up into the last breakdown area.
How it trades from there will tell us whether it wants to break higher early in December or later in the month.
Why Chart Patterns Work On Anything
How is it possible that a chart pattern I learned for stocks works on Bitcoins?
Shouldn’t they be completely different?
Actually no.
And that’s precisely why many technical (chart) traders do well no matter what they’re looking at.
That’s why my Crashing Stocks pattern is so powerful.
It doesn’t just work on stocks.
I see traders use it for Forex trading, futures, and yes, digital currencies.
You see, price action works similarly no matter what market you’re looking at.
And it makes learning to read a chart a POWERFUL tool.
Don’t take my word for it, see for yourself.
