You probably think timing the market is too difficult…
That’s true, if you’re a beginner and don’t have indicators to signal when stocks will move.
However, some of the most successful traders and investors have a unique ability to time the market to near perfection!
Yes, even Warren Buffet tries not to jump in when stocks get overheated.
But when stocks crash, you bet he’s first in line.
Timing the market doesn’t need to be complex, and I want to show you my techniques that lets you know when stocks are set to crash.
These techniques have allowed me to uncover “hidden” bear markets and cash in.
Some of my biggest trades for the year used one simple pattern.
 *A pattern I want to teach you!
*See disclaimer below
I used this one pattern nearly every week in my trading.
You can use mine or create your own.
That’s the beauty of what I’m about to show you.
Pretty soon, you’ll understand how to jump these stocks before the mammoth moves.
Timing the markets is possible
I need to start by deprogramming the lies most of you were taught.
Financial advisors tell clients that timing the markets isn’t possible or is extremely difficult.
Otherwise, they’d be out of a job!
They prey on laziness and fear of loss.
Yet, they’re one of the biggest market timers out there!
When you adjust or alter your ‘portfolio’ allocation – that’s market timing.
When you move a little more into stocks instead of bonds after a market crash – that’s market timing.
We all do it to one degree or another.
The difference is the time horizon we use.
As traders, we look for setups to play out within hours, days, and even weeks based on charts, storylines, or both.
It’s no different than portfolio allocation. We just use a different methodology.
Both traders and financial advisors use historical statistics, performance, and information to inform their decisions.
In fact, the only true pure way to not time the markets is to shove money into an index fund once and call it a day.
Qualitative vs quantitative indicators
Traders and investors look at two sets of information to make their decisions.
Think of quantitative as chart indicators and qualitative as storylines or economic measures.
When I invest in my Portfolio Accelerator, I research the companies extensively, looking at their businesses, growth potential, and business environment. I only look at the charts afterward.
Economists love to use forward-looking information like manufacturing durable goods orders published by the Federal Reserve.
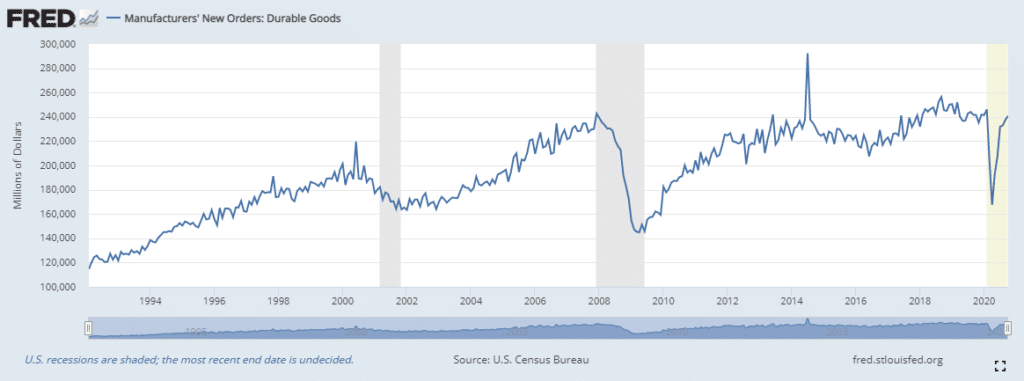
According to their thinking, orders for big-ticket items slow down before or at the beginning of a recession.
Quantitative indicators mathematical outputs using price action and or volume.
These break down into two subsets: leading and lagging.
Leading technical indicators try to predict turning points by measuring extremes like overbought or oversold conditions. Common ones are the Relative Strength Indicator (RSI) or any of the oscillators.
Lagging indicators tell you where price has been, providing information about the general trends as well as support and resistance levels. These include moving averages, Bollinger Bands, and the like.
Stacking for big payouts
Finding a set of indicators that work takes time and homework. It took me years before I came up with my chart pattern for crashing stocks.
I know other traders that use completely different indicators that are quite successful.
Coming up with your own methods often boils down to a few components:
- The indicators provide a signal
- They need to be used in conjunction with other items like chart patterns or qualitative information
- The more unrelated the other items are the better
- You will still need to apply some discretion on the trades
In general, most methods will find success around 65%-75% of the time on average.
Don’t be surprised if you struggle to break 45% or 55% for a while. There can be a lot of trial and error involved.
But, if you find that your method only wins 35% of the time, then just flip it around. Now you’ve got one that wins 65% of the time!
How to create big payouts
Part of what makes my pattern unique is what it does.
My strategy looks for reversals on overbought and oversold stocks.
You see, after sharp moves higher and lower, the snapback can be vicious.
That’s why I like to step in front of these with a well-time trade and clear risk parameters.
I don’t need this trade to win 60% of the time or even 50% of the time.
Why?
Because I structure these setups so the potential payouts far exceed the losses.
Let me show you what I mean.
Sign up for my upcoming seminar and I’ll walk you through some of these trades.
You see step by step how I put them together and, in some cases, killed it for enormous gains.
Why struggle to create your own pattern from scratch when you have my battle-tested approach today?
Click here to register for my upcoming seminar.
