Type ‘chart patterns’ into Google and you’ll find hundreds of examples.
Thing is, you don’t need hundreds of chart patterns to find success.
I trade just a few and do quite well.
One of my favorites killed it in February as the market fell apart.
I walked away with over $70,000 by Monday*
*See disclaimer below.
Now, there is one pattern, in particular, I want to go over today.
One that sent shares soaring premarket over 10%!
Most folks have seen it before but can’t trade them successfully.
They fail to recognize three core concepts:
- Risk management
- Context
- Trade management
Even my favorite pattern isn’t worth much without these.
I want to use a trade I’m in RIGHT NOW to show you how I applied this setup.
Chart Pattern & Context
Cannabis stocks are nothing if not controversial.
Yet, as lawmakers remove more restrictions, the industry looks brighter and brighter.
Most of the names are small-caps – some with very little volume.
That’s why I like to look at the MJ ETF to get a sense of the broader context.
And recently, whether from the election results or otherwise, these stocks found a buyer.
Which is important because it defines the context around the trade idea.
So as long as the sub-sector remained strong, things looked good.
Now, let’s look at the chart patterns that formed.
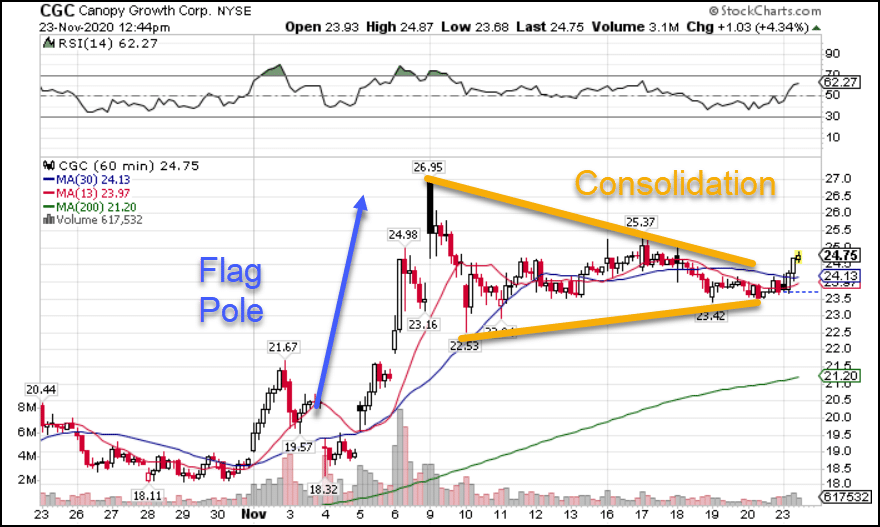
CGC Hourly Chart
The chart pattern displayed is fairly simple. It contains two main components:
- Flag pole – The blue arrow highlights a strong thrust higher, often due to a short-squeeze, earnings, or some other news event. It needs to break out of the previous consolidation range by a noticeable amount.
- Consolidation area – After a short move higher, I want to see price trade sideways in a narrowing channel. Connecting the highs and lows of the candlesticks with orange trendlines, you can see how price oscillates up and down in a tighter range.
I want you to think about what this looks like in the real world
First, you get a ton of buyers overwhelming the sellers, forcing prices higher.
At some point, they run out of strength, sellers gain traction or both.
As price heads retraces, it doesn’t go all the way back down as buyers step back in.
They push prices higher, but the sellers step in earlier.
This tug of war continues as each side steps in earlier and earlier, narrowing the price channel.
Eventually, they meet one another for a final fight.
More often than not, the stock breaks out in the direction it was heading.
Why?
Because when you step back and look at the big picture, more buyers want this stock than sellers dumping it. Otherwise, it wouldn’t have a bullish trend.
Risk management
As I mentioned earlier, a great setup doesn’t mean squat without proper risk management, which boils down to two key components:
- Risk/reward
- Win-rate
No matter what trade you take, there is always a chance it fails. That’s trading.
But, you can attempt to predict the outcome based on historical data.
I recommend a trade journal to log similar trades over time. That will help you gather important information like the win-rate.
Win-rate is the number of times the trade won divided by the total number of trades.
More simply – your odds of success.
If you don’t know it offhand, then start with 50% and assume it’s a coin flip.
Next, you need to define the risk and reward.
The risk is the distance between your entry and your stop.
The reward is the distance between your entry and the target.
Your expected outcome is a formula known as the expected value.
An expected value less than zero means you expect to lose on the trade, equal to zero you break even, and greater than zero you turn a profit.
The formula for expected value is as follows:
EV = (Win-Rate% x Reward) – (Loss-Rate% x Risk)
If your win-rate is 50%, then your loss-rate is 50%, like a coin flip.
To turn a profit on this type of trade, you need to make your reward greater than your risk.
Taking the CGC chart, I mark my target and stop. Then I look for my halfway point.
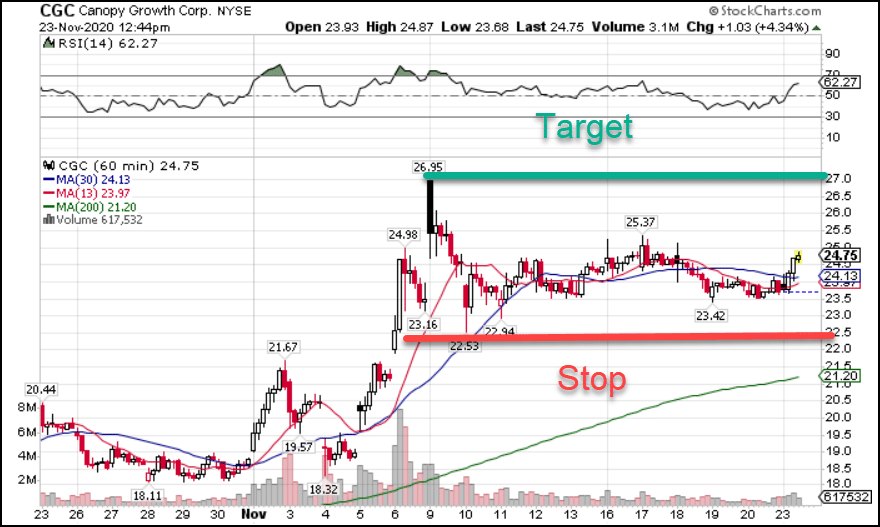
CGC Hourly Chart
Assume I set my target to $27 and my stop at $22.50. The halfway point is $18.
So, if I get an entry below $24.75, then my reward exceeds my risk.
The trick is to increase your reward relative to your risk as much as you can without reducing your win-rate. You also don’t want an entry that is so conservative it never fills.
Trade management
Lastly, I want to talk about the mechanics of executing a trade.
Buying and selling stock is pretty straightforward.
But options add other dynamics.
You need to account for time decay, strike prices, and implied volatility.
None of those apply to trading the stock.
Which is why choosing the correct options contract is so important.
And just as important, you never want to risk so much on a trade that one loss could destroy you.
Trading is an exercise in probabilities. Some win, some lose.
The size of your trade should be small enough that it allows you to take similar trades over and over to let the averages play out.
Learn my favorite pattern
Are you ready to learn my favorite chart pattern?
Then join me for my upcoming seminar where I reveal this setup that I use to trade the markets nearly every day.

*Results presented are not typical and may vary from person to person. Please see our Testimonials Disclaimer here: https://ragingbull.com/disclaimer
