Trying to catch a crashing stock doesn’t usually work.
If you don’t have the proper strategy…
It’s as if you’re trying to catch a falling knife, and it can slice you up and bleed your account.
Now, it happens to nearly every trader — they see a stock get crushed and try to buy the dip, only to watch the stock drop even more…
Until they reach their max pain point and have to puke the position.
I want to help you avoid that gut-wrenching feeling, so I want to show you one of my favorite setups to buy the dip when a stock drops real fast.
In fact, I used this setup with DocuSign (DOCU) and Etsy (ETSY) to score a big windfall.*
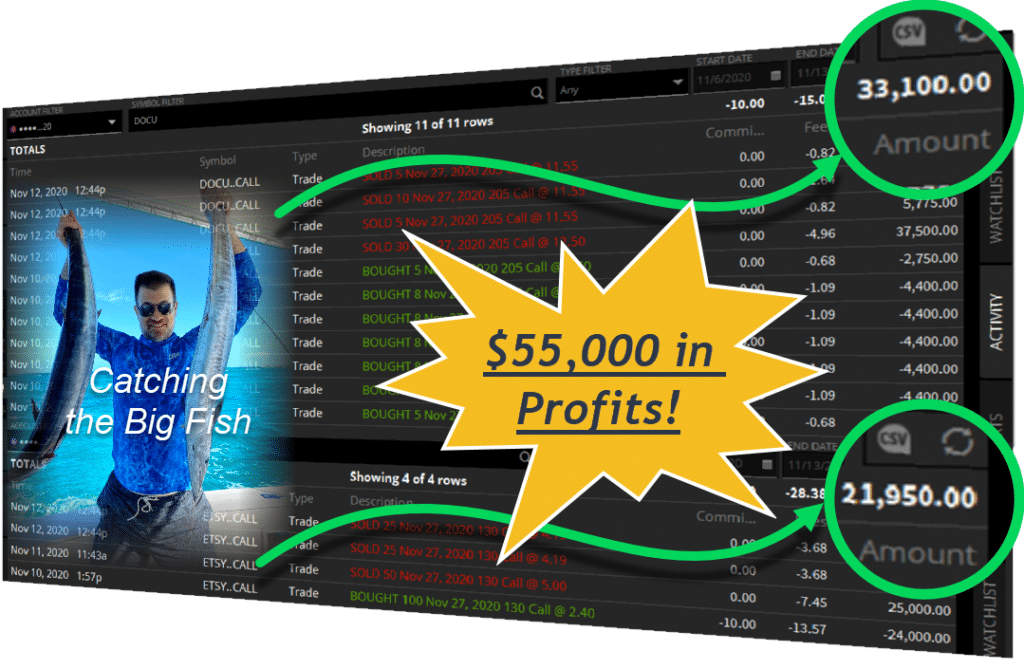 A great win for Total Alpha using some of my favorite techniques*
*See disclaimer below
Both of these displayed nearly identical reversal patterns at the same time.
Although these trades aren’t complex, they offer a wonderful teaching opportunity.
Showing you how I found these trades, I want to take you inside my mind as to what I was thinking.
That way are you not only able to find these patterns on your own but understand how to analyze the situation as well.
Reversal setups
Trading tends to fall into two different categories: reversals and continuations.
Take this chart in Stitch Fix (SFIX) for example.
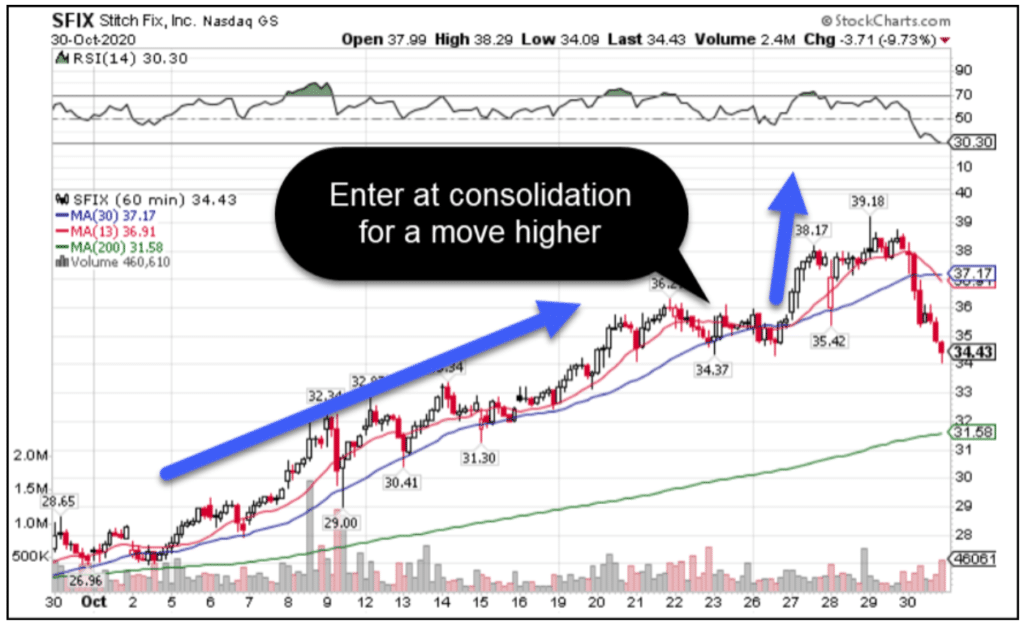 SFIX Hourly Chart
In late October, shares stopped their noticeable trend higher and moved in a tight range sideways for a few days.
Anticipating a move higher, buying shares here would be a continuation trade.
Now, let’s look at the chart for Zscaler (ZS), another trade I took at the same time for a sweet profit.
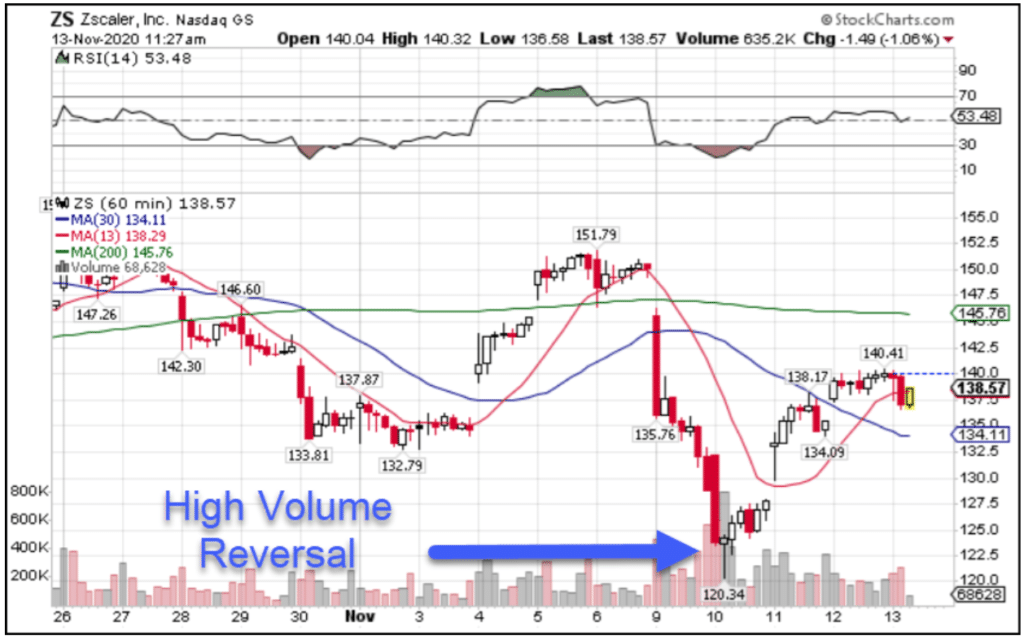 ZS Hourly Chart
For nearly a month straight, shares of ZS plummeted, with the culmination at the noted low.
When the reversal showed up, I waited until I had a candlestick chart formation to trade.
That isn’t always required. I know plenty of traders who use support and resistance levels (spots where price is likely to reverse) that simply buy or sell at those points with either dollar amount or percentage stops and targets.
Neither continuation nor reversal setups are better than the other. Personally, I use both of them. Some only stick with one. You should go with whatever you are the most comfortable with.
Two requirements – price level and a setup
Let’s take a look at the charts for DOCU and ETSY. I want you to keep the chart of ZS handy as well for comparison purposes.
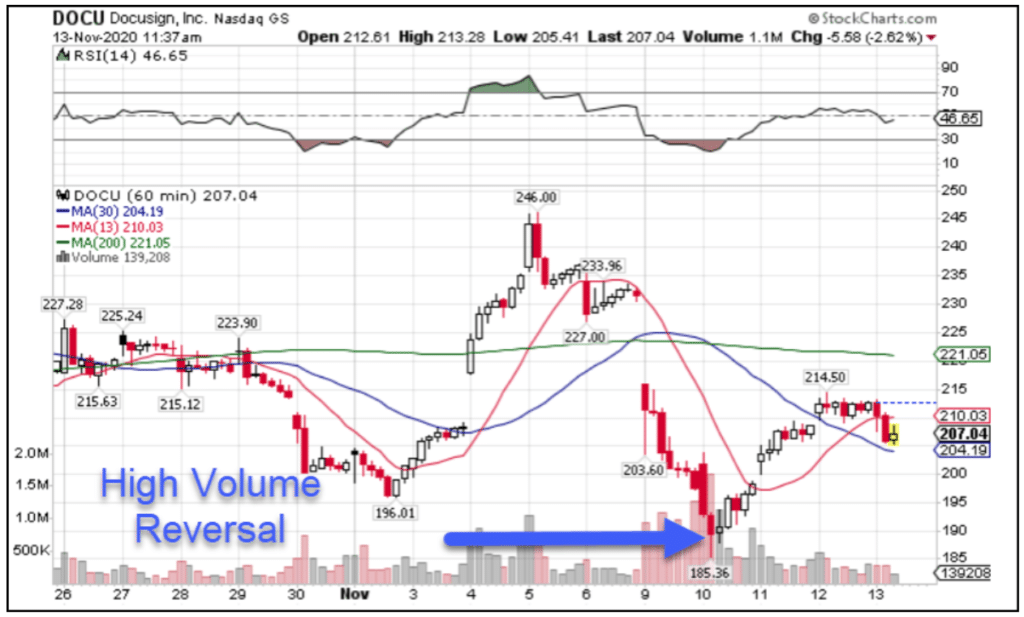 DOCU Hourly Chart
 ETSY Hourly Chart
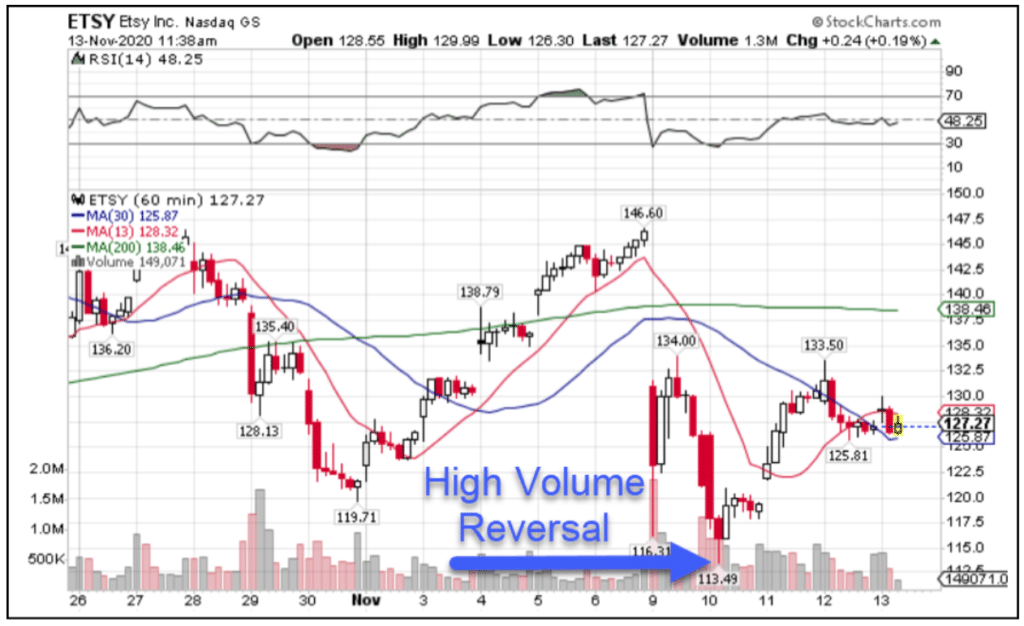
What do these charts have in common?
Let’s list it out:
- High volume at the reversal point (2x-3x above the norm)
- A reversal candlestick pattern (In this case the following candle or two closed above the high of the candle that made the low)
- Important price level….
Ok so that last one isn’t obvious from the chart, but let me show you why it’s true.
For that, we need to zoom out a little bit.
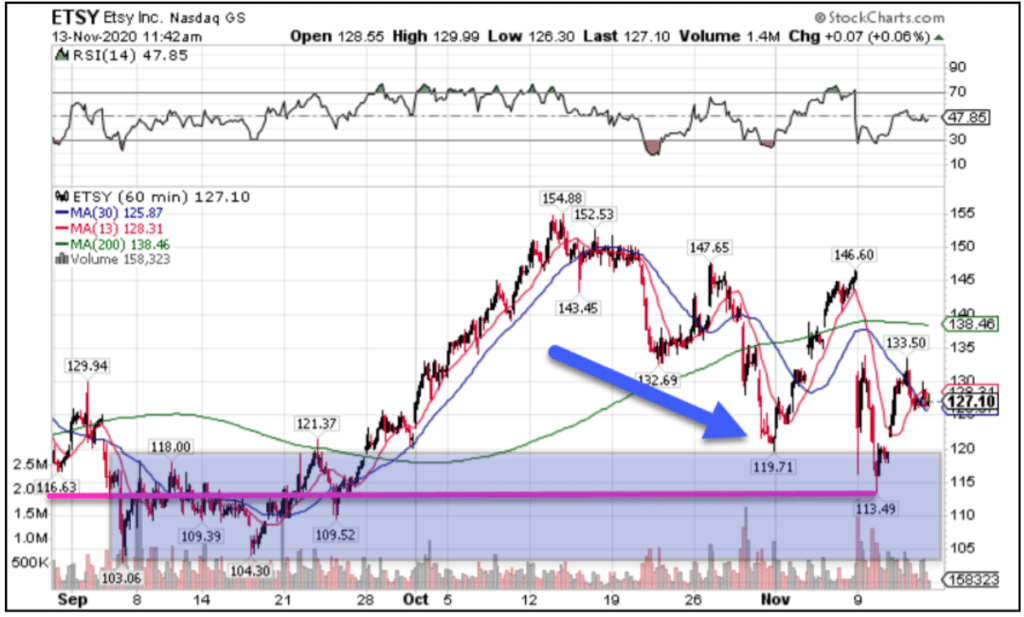 ETSY Hourly Chart
Going back to September, I took the last place where shares consolidated (traded in a narrow range sideways) and extended it forward.
You can see how it acted as support in early November.
When price got down to its recent low, that landed about halfway into the range.
These are spots where I would look to find reversal setups.
So, having a price and a setup, I’ve got the signals I want for a possible trade.
DocuSign’s support price was a little different.
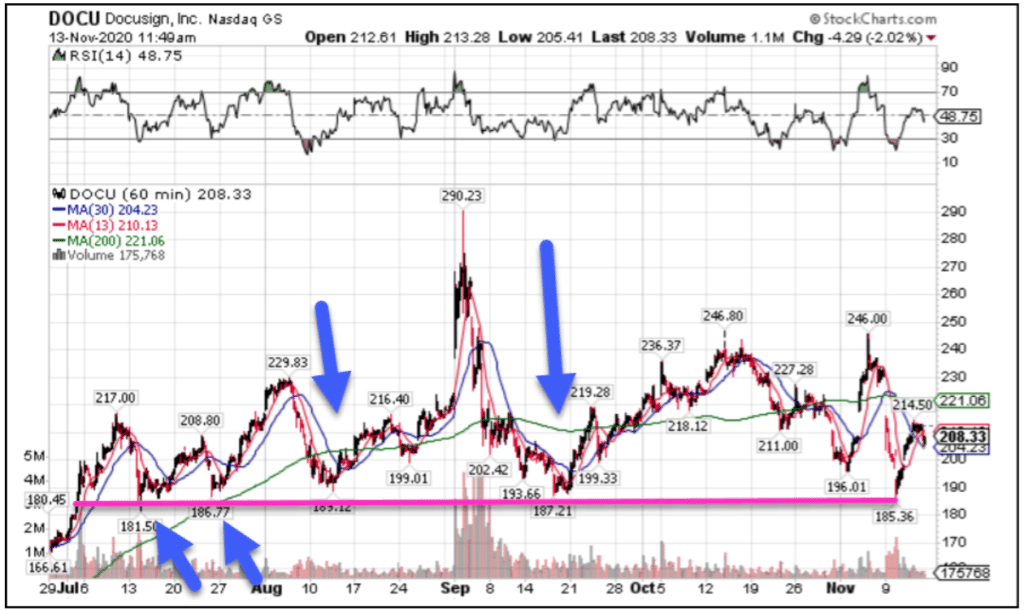 DOCU Hourly Chart
Take the pink line as your support.
Using the arrows, you can see how shares would drop into that price (or close) and bounce not just once or twice, but four times!
So, when shares came into that same area, it offered another chance to find a reversal setup at that support level.
What I want you to take away from this is that these setups required two components for the trade: a price support (or resistance) and a reversal candle setup.
If you had a reversal candle setup without support, it might be a fakeout or have lower odds of success.
Trading support without a setup is possible, and as I mentioned people do it, but it’s more difficult to succeed in my experience.
Creating the trade
Once I had the reversal pattern and a price level, the trade structure itself was pretty straightforward.
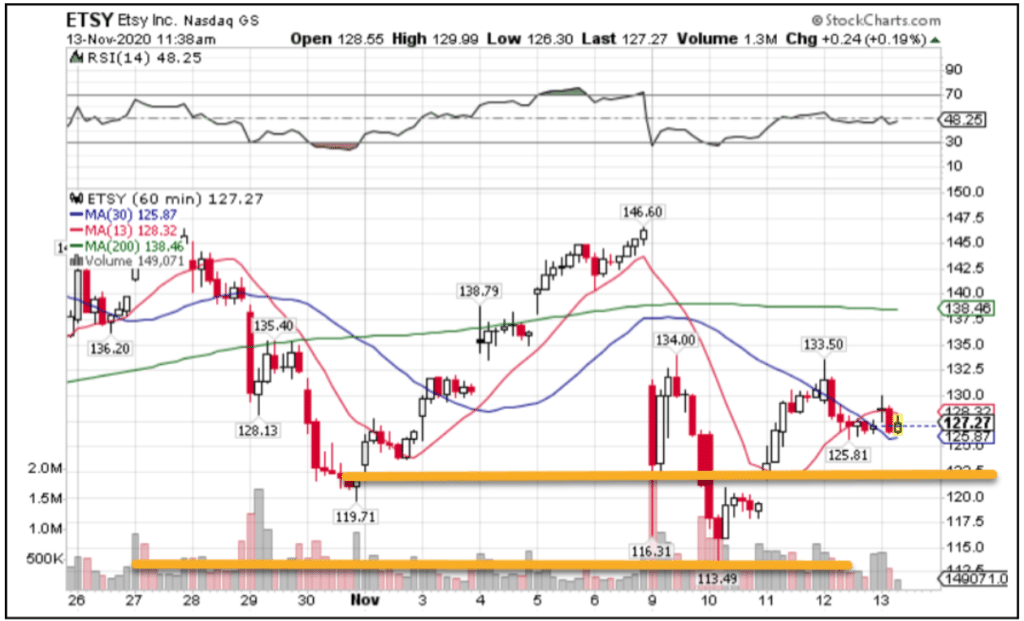 ETSY Hourly Chart
Using the lowest point from the candlestick formation, I put a close below that as my stop out for the trade.
My target is a move back towards a resistance level.
In this case, I went with where several candlesticks closed, opened, or made lows/highs.
One of the drawbacks to this particular chart pattern is there isn’t a clear target like there is a stop, so it requires some discretion.
Now, one of my favorite chart patterns I use to frame many of my High Octane Options Trades.
In fact, I built a scanner that I stream for members I, and they don’t miss out on potential opportunities.
In my upcoming seminar, I explain how I use this pattern to design dozens of trades.
Join me and learn more about this pattern and see if you can spot it in your own trading.
Click here to sign up for my upcoming seminar.
