Days like yesterday hit you one of two ways: like you own the world or it’s passing you by.
I was in the second camp since I didn’t have many positions going into the weekend.
While I felt the urge to jump in on Monday, I didn’t just click on the first call options I saw.
Taking a step back, I looked for new setups that formed throughout the day.
Then, I treated each as its own trade.
I want to walk you through a few of these ideas to keep in your back pocket such as:
- Short squeezes
- Moving average reversals
- Gap fills
That way the next time the markets gap up overnight, you have a playbook to work from.
And they also work great in slower markets as well!
Short squeezes
The other day, we saw NIO take off like someone lit a fire under it.
Shares more than doubled in a month’s time.
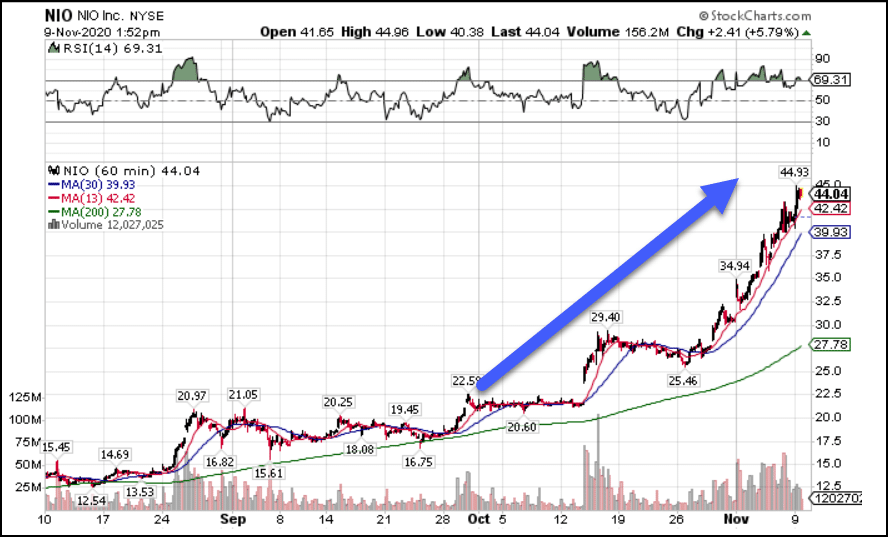 NIO Hourly Chart
Even today, there’s still a 6% short-float on the stock.
Back before it took off, it was over 20%.
This is what’s known as a short-squeeze.
A short-squeeze occurs when traders borrow on margin to bet against a stock. They lose money as shares rise. Eventually, their broker forces them to close the position.
To do that, they buy shares back. That sends price higher, kicking more traders out of their positions, driving a cascade of buying.
So how do you find stocks like this?
You want to make a list of symbols that have a high short-float.
There are a variety of places you can find them on the web for free or from your broker.
Once you have that list, look for ones that are near their all-time highs or recent highs. This makes it more likely traders have stops loss orders right above those highs.
So, once price breaks through that level, it should trip those orders to become market buy orders.
And that starts the buying cycle.
A couple of companies that currently fit that bill: Stitch Fix (SFIX), Chewy (CHWY), and Plug Power (PLUG).
You probably noticed these are all momentum-style names.
Large-cap stocks don’t tend to have high short-floats, which is why they aren’t necessarily good candidates for short squeezes.
That doesn’t mean it can’t happen. Just that it’s less likely.
Moving average reversals
If you’ve followed my newsletters before, you’ll know that I’m a big fan of the 200-period moving average on the hourly chart.
It acts like a magnet and often a floor when a solid stock seeks support.
Here’s an example with Newmont Mining (NEM).
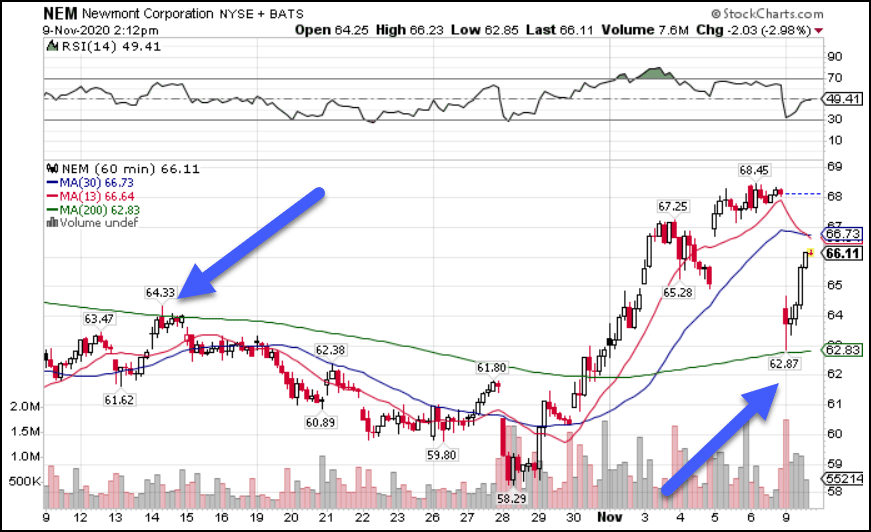 NEM Hourly Chart
Prior to November, the 200-period moving average acted as resistance for the stock.
And yesterday, when shares came crashing down, they found support almost to the penny at that same moving average.
Now, I could certainly enter a limit order right at the moving average, hoping it bounces. But, I’d rather wait and see how it reacts.
If I get a reversal candlestick formation or chart pattern that forms on top of (preferable to underneath) the moving average, then I can use that for the framework of my trade.
Gap fills
Another trade idea that works similar to the moving average reversals are gap fills.
When stocks open up significantly higher or lower than the previous day, they create gaps in price.
Although most of these fill within a matter of days, they sometimes remain open for weeks, months, and even years.
These can be very powerful tools when a stock looks like it’s in freefall.
Just look at how it worked on ETSY when it was down double-digits on the day.
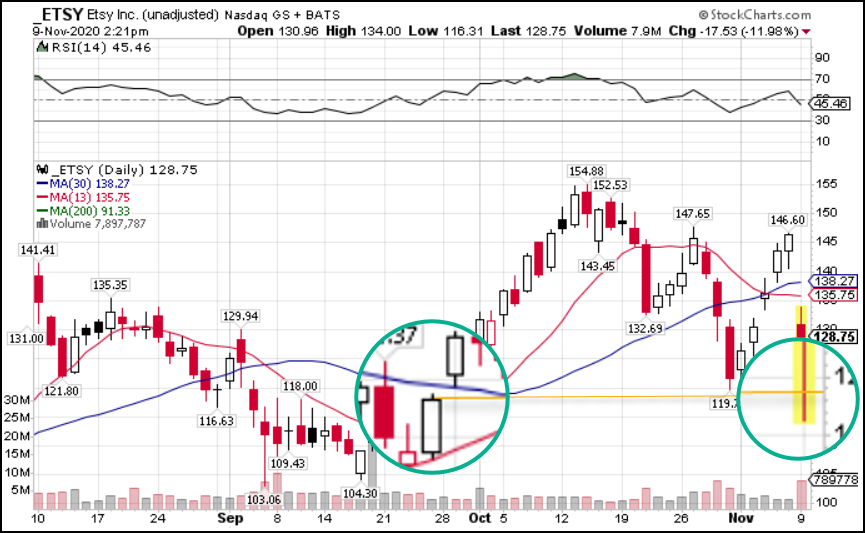 ETSY Daily Chart
The price on the gap fill was $118.28.
Etsy made a low of $116.31 before ricocheting back to $128.
Again, I could place a limit order right at that level and give myself enough room for a stop and target, hoping for the best.
Instead, I prefer to look for some reversal signal intraday that gives me some extra confidence in the trade.
Need more trade ideas?
Then join me for my upcoming seminar where I reveal my top trading pattern and how I use technology to give myself an edge.
Now is a fantastic time to leverage all the tools you can to dominate this market.
Click here to learn more about my upcoming training.
