As the dust slowly settles, some stocks clearly show promise while others not so much.
The first to come flying out of the gate were big tech companies.
So where would I want to buy these companies?
That’s what we’re here to discuss.
I want to show you where the key support levels are, along with setups that I believe can deliver outsized returns.
But first, I want you all to take a minute and refresh your knowledge on options trading because it will be important for our discussion.

Check out my Ultimate Guide to Options Trading – no strings attached.
Now, let’s start by talking about our favorite of most traders – Apple.
Apple (AAPL)
Over the last few weeks, I pounded the table on big tech.
I thought shares were oversold and these companies deserved the prices they traded at.
My opinion has not changed.
If anything, I’m more bullish than I was before.
Look, it’s not easy to look at stocks lighting up the screens and think, ‘Wow – what a great buying opportunity.’
And I’m NOT chasing these trades, giving into my FOMO.
What I am doing is picking out prices that I want to own these stocks at and waiting for pullbacks accordingly.
What does that look like for a stock like Apple?
Well, let’s see what the chart says.
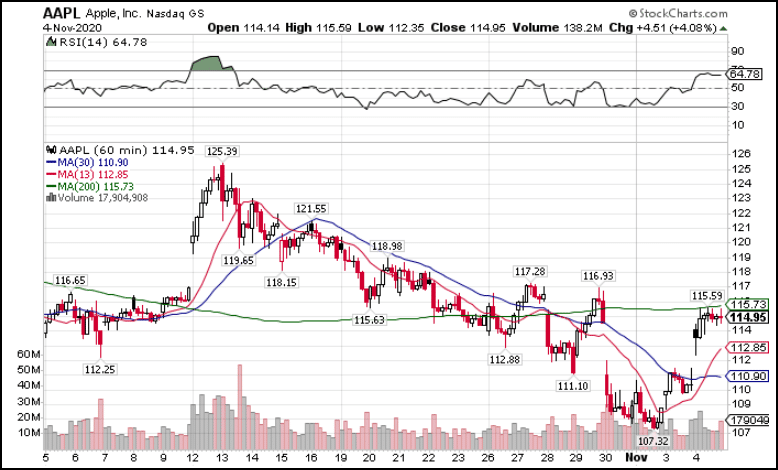
AAPL Hourly Chart
Here, we have a great setup.
Shares created my money-pattern crossover, which popped onto the scanner in my High Octane Options service.
On top of that, price made a bullish move up towards the 200-period moving average on the hourly chart.
I expect that to hold back a larger run for a few days.
If I get my wish, Apple would pull back down to $110-$112, which would be a great spot to pick up some calls.
What I like about this company is their international exposure. Although that can sometimes be a liability, their presence in China, whose economy appears to be recovering nicely, should boost their sales.
Amazon (AMZN)
Over the last few months, I trade in and out of Amazon quite frequently.
If shares weren’t so darn expensive, it would play a bigger part in my Bullseye Trade of the week.
At the moment, Amazon, like many of the big tech stocks, is making this tall bullish flag pattern on the daily and weekly charts.
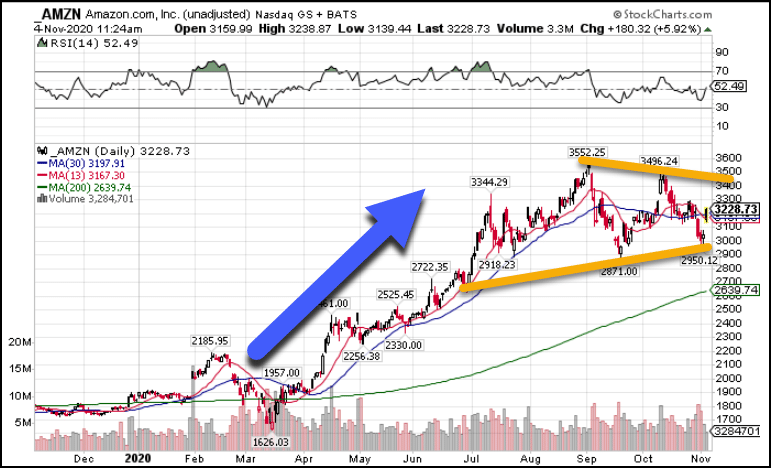
AMZN Hourly Chart
The difficulty here is the trading range is nearly $600, making it near impossible for small accounts to trade.
That said, I have some clear trendlines to work with.
Following the solid orange lines, I connected the highs and lows of the candlesticks, forming the boundaries for the chart pattern.
If I can pick up the stock near the lower portion of that range, I stand a good shot of making money on call options even if it doesn’t break above the upper trendline.
Wiaaplth the trading range being so wide, even capturing half of it should yield some serious profits.
Zooming in on the hourly chart, we see a similar setup to Apple.
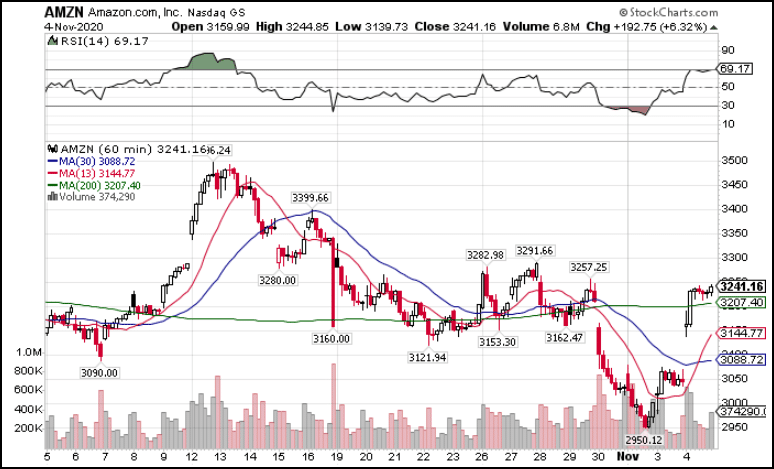
AMZN Hourly Chart
We’ve got the moving average crossover that showed up on the scanner as well as a nice gap.
I don’t expect this one will come back as much as Apple might. So, I need to be prepared to take a smaller position and scale into the trade, starting at the lows of yesterday around $3150.
From there, I would add to my position all the way down to around $3050.
If shares close the day below the recent low of $2950, the trade is over and I stop out.
Facebook (FB)
Last up on the docket is Facebook.
Of the three, this one provides the weakest risk/reward simply because it moved so much.
Take the highs from early September and the lows from later that month.
Now figure out where 50% of that is.
Here’s what it comes out to for each of the three:
- AAPL = $120.54
- AMZN = $3211.63
- FB = $274.40
Apple is still well below the halfway point.
Amazon is just above.
Facebook, is a ways past.
So, if I got into Facebook, I’d prefer to have a significant pullback.
Now, as I look at the hourly chart, we have the same setup forming as the other two, with one key difference.
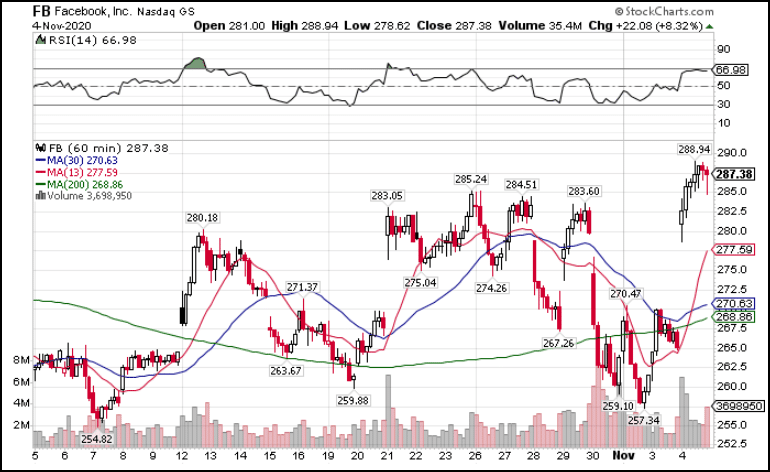
Facebook Hourly Chart
Facebook is the only one above the 200-period moving average.
The other two are not.
That gives it a much more bullish texture than the other two.
So, with this one, I’d be happy taking an entry in and around the 200-period moving average. That would land it close to the crossover and the recent breakout area.
Plus that puts be below the halfway point.
Get my next big trading idea before Monday’s open
Each week I send out my best options trade idea before the market opens Monday morning.
I lay out the full schematic of what I’m trading, why, which contracts I want, my entry, stop, and target.
There’s still time to sign up before the next one goes out…and it very well could be one of these three stocks!
