Markets have been choppy lately.
But we all know they’ll eventually break out one way or another.
So, how do we know when that is?
It’s one question all traders have on their minds right now — with the election, caseloads, and a Fed meeting.
I want to make sure you have the tools necessary to trade successfully.
There are three clues I want to see before I start loading up my bull basket:
- Daily closes back above the hourly 200-period moving average in major indexes
- A meaningful contraction in volatility
- Reversal chart pattern
Putting these signals together isn’t a guarantee that I got it right.
What it does give me is an objective analysis that tells me where I’m right and where I’m wrong…just like a trade setup.
I want to see clear signals and use support levels.
And here’s what that looks like.
Analyzing the indicators
Let me briefly walk you through each of the indicators and what they mean.
If you’ve read my newsletter for any length of time, you’ll know I’m a big fan of using the 200-period moving average on the hourly chart.
Not only do I trade against it as a support level, but I also use it to identify general market direction.
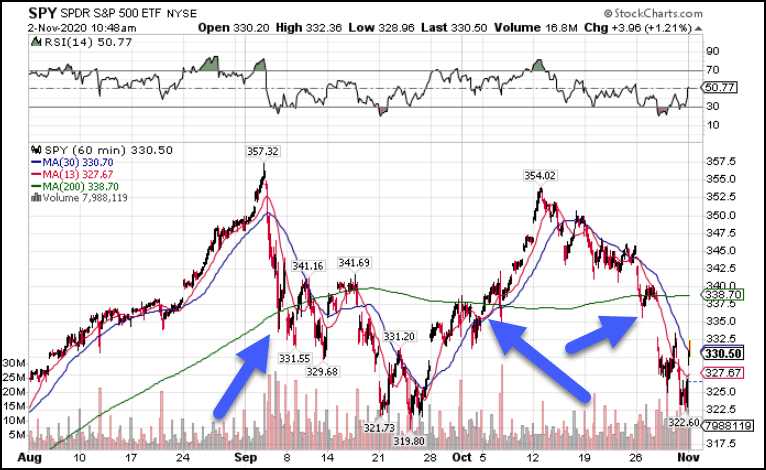
SPY Hourly Chart
You can see here how when the SPY traded over the 200-period moving average, it maintained its bullish features.
As it fell into the moving average, it used it for support before trading lower.
Once it came back into that level, price found resistance for a short while.
After it managed to break above, it showed a bullish character until we saw the bearish money-pattern crossover, where the 30-period moving average crossed below the 30.
Again, it found support at the 200-period moving average briefly before collapsing through.
Markets cannot make a sustained run without holding this level. You can see why it needs to clear it before making a run.
Next, the volatility index known as the VIX needs to contract meaningfully.
Since the crash in March, the VIX remained elevated compared to historical averages.
Typically, the VIX ranges between 15-18.
Lately, it’s been 25-30. And in the last few days, it’s closed in on 40.
That indicates market participants spending a lot of money to hedge themselves against downside risk.
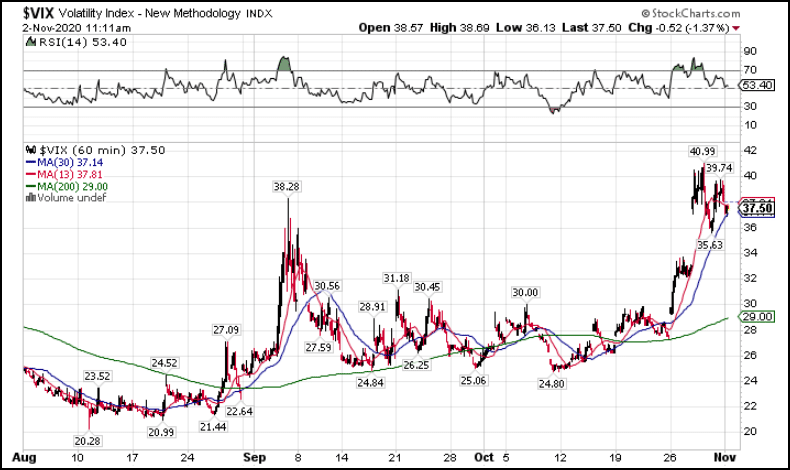
TA Hourly Chart
You can also see how the VIX is well above the 200-period moving average.
That’s bullish for the VIX which tends to be bearish for stocks.
For me to like stocks again, I want to see the VIX get back down to the 30 area. Anything below that would be gravy.
Lastly, I need to see a reversal pattern on the chart, preferably off a support level.
Reversal patterns are a core component of my High Octane Options trades and proprietary scanner.
A good example is my recent trade in Rocket Mortgage (RKT).
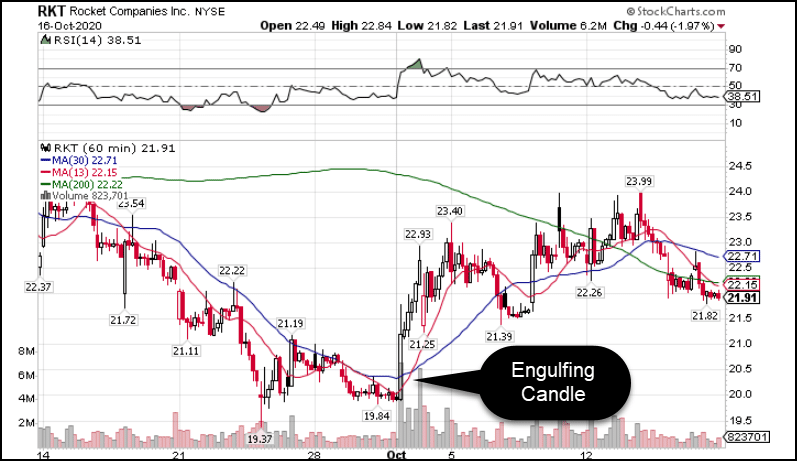
RKT Hourly Chart
Shares created a large engulfing candle – a candle whose body encompasses two or more prior candles.
What makes this prominent is how many candles it eclipsed in one swoop. Not only that, it did so on extreme volume.
This is one example of how these reversals take shape. In most cases, they tend to occur on significant volume.
Although a bit exaggerated, you can see that same phenomenon on the SPY daily chart.
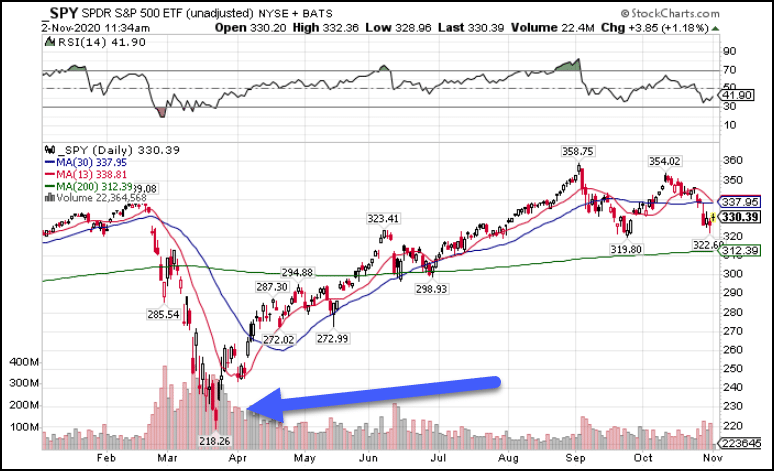
SPY Daily Chart
Volume jumped to hundreds of millions of shares per day as stocks bottomed. While it doesn’t always come with such an obvious spike, anything that’s 1.5x – 2x the average daily volume is a good signal.
Designing a trade
Assume all three indicators flash the go signal. What would I do?
For starters, I would look for a typical setup in a chart that I liked. It could be any one of my favorite stocks like Tesla, Amazon, Apple, or even the major indexes like the SPY, QQQ, or DIA.
A common setup I look for is a moving average crossover on top of the 200-period moving average on the hourly chart.
Here’s a recent example with Caterpillar (CAT).
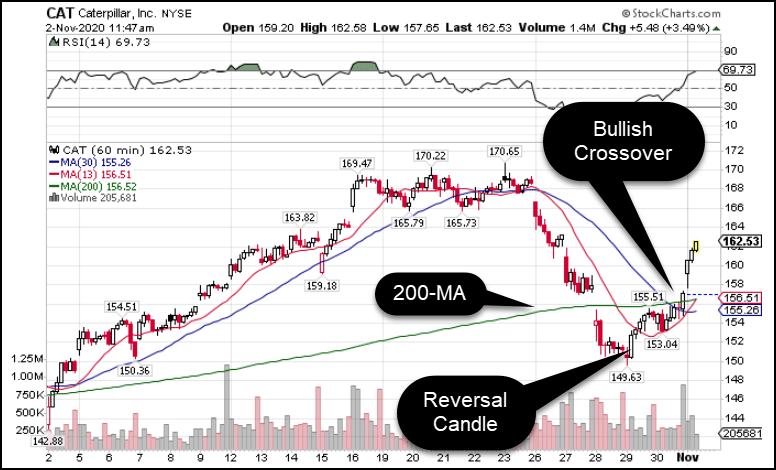
CAT Hourly Chart
With this chart, I have a reversal candle and a bullish crossover all on top of the 200-period moving average.
In this case, it sent shares soaring the following day.
If I saw this trade before that, I’d have a pretty simple setup:
- Close below the recent low ($149.63) on daily or multiple hourly candles, I stop out of the trade
- Otherwise, I shoot for near the recent highs around $170.
Simple and elegant.
I know where I’m wrong, which defines my risk and reward.
Now, if you aren’t sure how to construct a trade like this, don’t worry.
My Bullseye Trade of the week delivers my best trade idea each Monday before the market opens.
I lay out my entire plan including:
- Stock symbol and setup
- Stop and target levels
- Which option contracts I’m eyeing and the entry price
Not only do you learn how to put together a solid trading plan, you get my best trading idea too.