I know the market’s been tough lately.
But that hasn’t stopped me from sifting through charts, and picking out setups I like.
In fact, I want to share with you what I’ve just discovered.
But most importantly, I’ll explain why I like these plays, and how you too, can find them in the future.
Why?
Because coming up with a game plan in this market is a must.
Just look at how effective it was for me in these video trade recaps of Apple and Tesla.
That’s the kind of blueprint I want to put together today with you, starting with one of my favorite stocks to trade.
Tesla (TSLA)
Many of you are probably skeptical of this stock and rightfully so.
Shares ran from August of last year to a high this year of nearly 1,000%!
When someone tells you there’s a way to play this to the long side, you should question their sanity.
So, allow me to make my case for the company with a key chart.
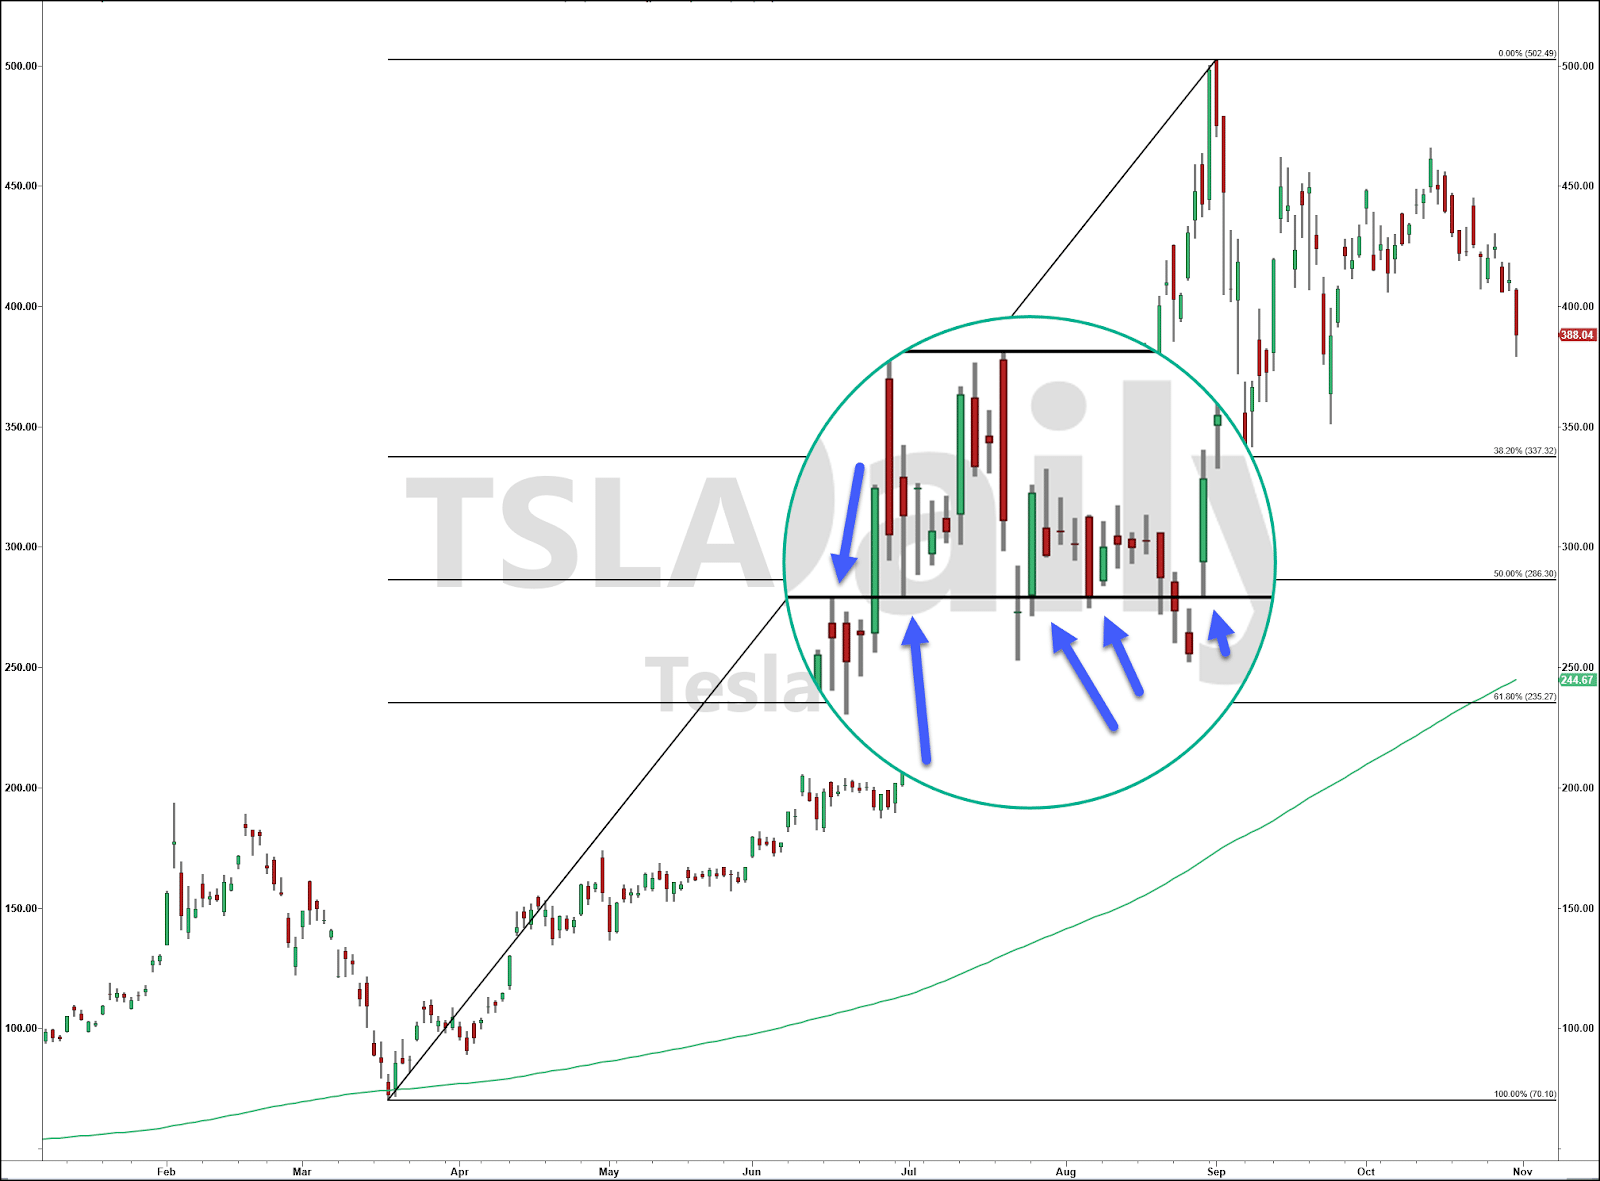
TSLA Daily Chart
I want you to focus on the 50% retracement (middle line).
While I typically play the hourly charts, the daily look here gives you a great perspective one some cool concepts.
First, I want you to take a look at the drawing that connects the high and low of the chart.
This uses the Fibonacci retracement charting tool, a common technical indicator traders use to analyze charts.
To briefly explain it, you choose an obvious top and bottom in a chart. Then, you look at three key levels in there: 38.2%, 50%, and 61.8%.
There are other numbers you can use, but we’ll limit our discussion to these for now.
I often get asked how do I know whether I drew these correctly.
While there’s no definitive answer, here’s one way to confirm you’re on the right track.
You see all those blue arrows in the magnified area?
Those all point to places where price either stopped short at that price, opened at that price, or closed there on the daily chart.

And all that happened before it ever made the high necessary to create this retracement!
But that’s not the only reason I like that price.
Take a look at the 200-period moving average on the daily chart (the green line that slopes higher).
Every day, it inches closer to that same level.
If I forecasted that moving average into the future, it reaches that same area in about 3 weeks.
Why does that matter?
Because that lines up with when I expect the post-election selloff to conclude!
But, I also pointed out two key points: November is traditionally a bullish month and Thanksgiving a bullish holiday.
And it just so happens that the 200-period daily moving average reaches that pivotal price level right around that time.
Take a step back and think about what that means for a moment.
You have a Fibonacci retracement level that already showed its importance before ever creating the high necessary to make it a Fibonacci level.
That’s another reason why traders often use Fibonacci extensions. Think about it. If you doubled the price from the low to the 50% retracement, that takes you exactly to the peak in Tesla shares.
Pretty awesome right?
The question is how do I play this amazing forecast?
Well, let’s start with an obvious point – I can be 100% wrong and that’s ok.
Not every trade works out, which is why risk management is so important.
That’s why I like trading options.
And with so much uncertainty around the election and COVID, I want to manage my risk and deploy the best trading strategies that take advantage of the situation.
In this case, I need to allow for enough time and wiggle room that lets shares of Tesla find support and then bounce.
Otherwise, my options may decay too quickly.
So, choosing the right option contract is a must.
And it’s one of the key lessons in my upcoming Total Alpha seminar.
Now look, I know that it’s not easy to step in front of a runaway train.
Heck, I tried to catch a falling knife before only to get sliced.
That’s why I put together this short video on 10 tips for trading post- COVID.
It highlights the very concepts we’ve covered in this article as well as what I see as the critical elements to prepare for a trade like this.