Want to see something spooky?
Take a look at the following option chain:
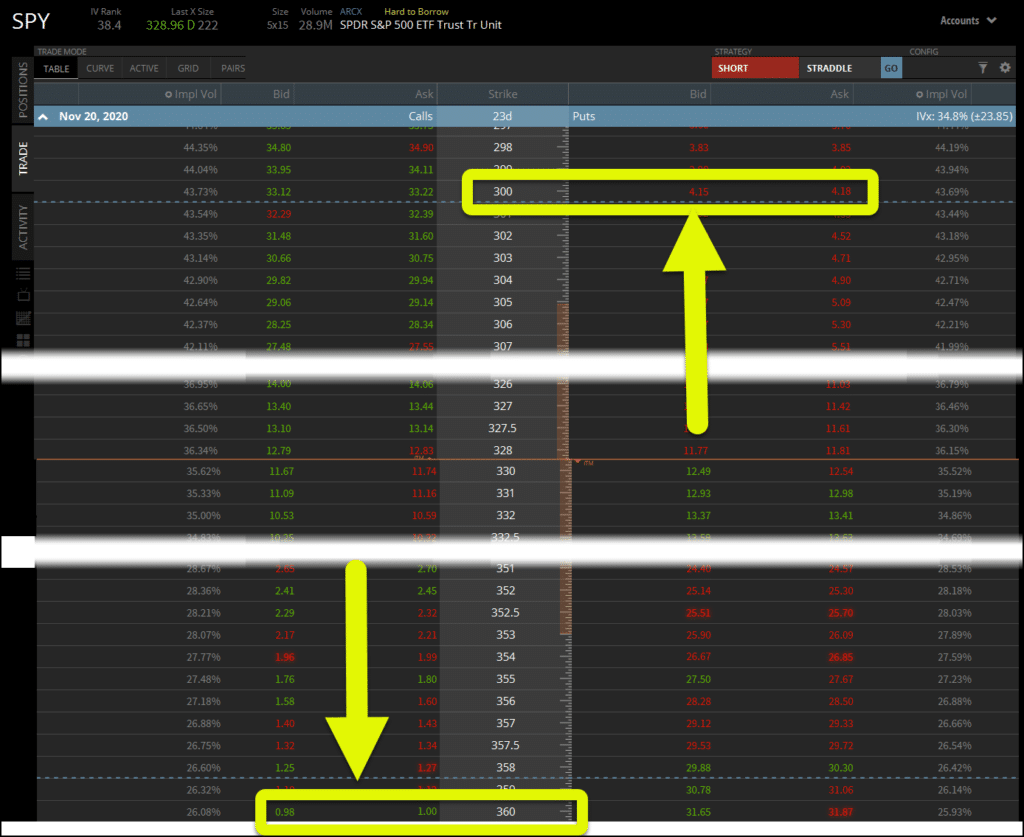
With a current SPY price of ~$330, the call options for the $360 strike, $30 away is $1.00.
But the put options at the $300 strike are $4.17!
Why does this happen?
Demand for the equidistant puts are more active than the calls.
But that’s not all going on here…it has to do with something called the IV Skew which I’ll tell you but shortly.
I’ll explain to you what it is, and why it’s so important during this volatile period in the market.
There are opportunities ready to be exploited, if you take what I’m about to show you, and start applying it.
What is IV Skew
Put simply, IV Skew is the difference between the price of options that are equidistant on the call and put side.
In the example above, I went $30 out-of-the-money on either side of the current stock price.
When I say the current price, I’m referring to at-the-money options where the strike price matches the current stock price.
So why were the prices so very different?
Simple demand.
Although most option traders know this by another name – implied volatility.
As demand increases for an option, the implied volatility increases as does the price.
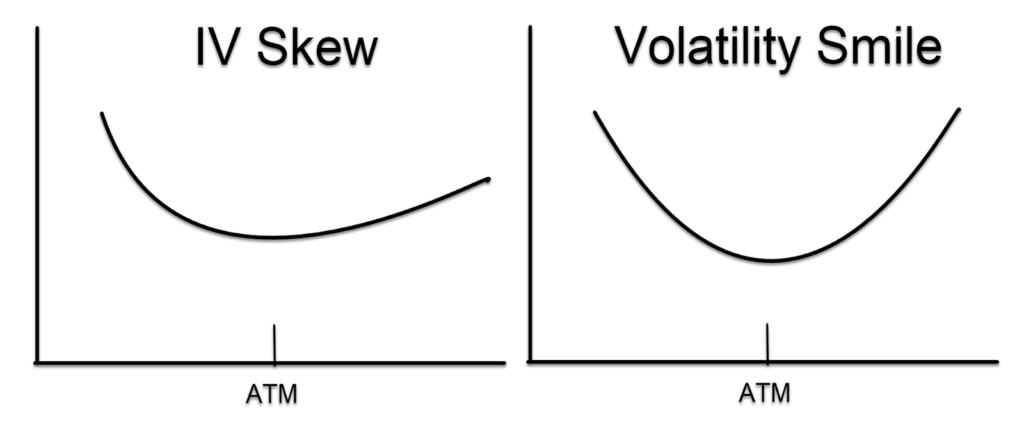
Here’s what skew looks like.
Now you probably are wondering if implied volatility increases the farther out you go, why are options cheaper?
Well, that’s because even though IV increases, the pricing component that comes from the distance between the strike price and the current stock price declines faster.
So, while IV increases, the distance component decreases.
Why does this happen?
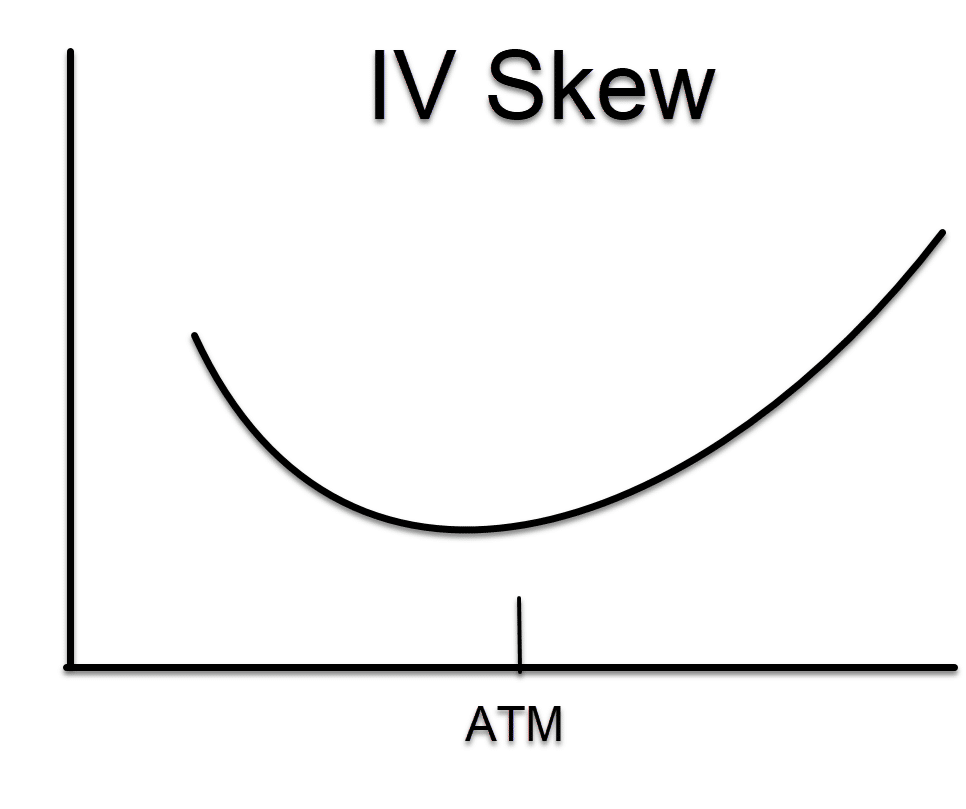
With the SPY options, you get something that looks like this:
Big money portfolios often hold tons of stock positions. To protect those, they prefer to buy protection against a basket index.
Otherwise, they’d have to manage options for each individual stock, driving up their costs.
We see the opposite of this happen with stocks where calls are often more expensive than puts.
Traders like buying calls on stocks because they have more upside potential than the indexes.
You’ll never see an index get bought out like a stock!
Now, there’s also a little history here too.
Prior to Black Monday in 1987, far out-of-the-money options were fairly cheap.
After that historical drop, options market makers started to price in those outlier events because it turns out…they happen more often than you might think!
Using this to your advantage
Here’s how I turn this information into actionable trades.
To start, I like to do the opposite of what the market does!
That means I like to sell put options on the SPY and buy calls.
Why would I do that?
When I sell put options on the SPY, like in a put credit spread, which is a bullish bet, I can go pretty far away from current price and still get a nice payout.
You see, the same demand that keeps option price high so far out can work in my favor.
If folks want to buy them, then why shouldn’t I sell them?
Let’s use the option chain from above as an example.
If I expect the market to move $30, but I’m not sure of the direction, which option would pay more?
Well, the $300 strike option sells for $4.00 and the $360 option sells for $1.00.
I know which one I’d rather choose!
At the same time, if I want to buy call options, I’d rather buy calls on the SPY than on a stock.
This works especially well after a hard selloff and markets are trying to find a bottom.
I can buy far out-of-the-money call options for relatively cheap.
Keep risk in mind
A word of caution.
When buying options, the most I can lose on a trade is the price I paid for the option.
However, selling options is a different story.
Selling naked options leaves me open to undefined risk.
Does that mean I want to only buy options?
Not necessarily.
When I own an option, time works against me. Every day that passes eats away at the price of that option.
On the flip side, that same decay works for me when I’m a seller.
So, there is a tradeoff between the two.
Luckily for you, I teach traders how to use both.
And a great place to start is my Bullseye Trade of the week.
With one pick a week, you get my best trade idea before the market opens on Monday.
Can one trade a week really make a difference?
See for yourself.
