Hello trader,
If you bought $10,000 of ZM at the open of their IPO, you would have over $70,000 today.
With an epic run of over 730%, it’s natural to ask…
Are shares of Zoom Media setting up for an enormous crash?
Most definitely.
But that doesn’t mean I want to bet against the company and here’s why.
In the last few weeks, I managed to take a handful of bullish trades on the stock….
And then turned right back around and made money betting against it!*
*See disclaimer below
I explained to my Total Alpha members how I used the expanded volatility to my advantage.
And it’s something you should understand as well.
Because not only can it improve your trading, but help you read charts in a new light.
Fundamentals are so-so
Let me briefly talk about the fundamentals of Zoom, the metrics used mainly by investors.
Their earnings relative to price (P/E) ratio, is excessive. At their current profitability, it would take over 600 years to pay back one share of stock.
But, their growth is incredible.
When you take that into consideration, their price to earnings growth ratio (PEG) is 2.4x. That’s equivalent to a roughly 8-year payback period.
Here’s the thing.
I question their growth outlook.
There’s no doubt that they’re a huge beneficiary of the pandemic and will continue to be as long as it lasts.
But looking out 2-3 years, under the assumption a vaccine comes and life returns to some aspect of normalcy, how quickly will their growth rate erode?
Right now, many use their products out of necessity.
I don’t see that continuing within a couple of years.
Take the reaction from Netflix which had insane expectations. Shares tanked because they simply didn’t make enough money.
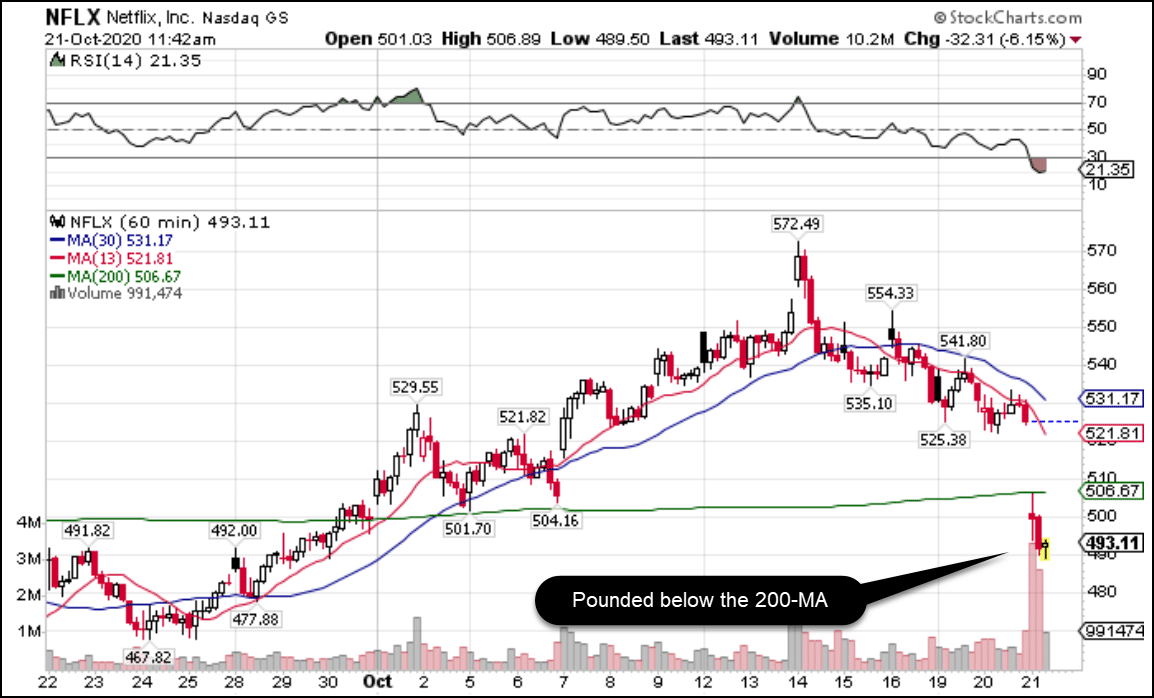
NFLX Hourly Chart
That’s where I see things heading for Zoom.
Until then, there’s plenty of opportunity to trade the company.
Using IV to your advantage
Zoom’s implied volatility is exceptionally high, both historically and compared to other equities.
But, a lot of that is due to the extremely wide ranges.
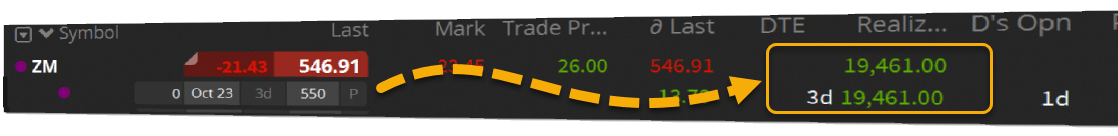
Take a look at a chart of ZM’s implied volatility over the last year.
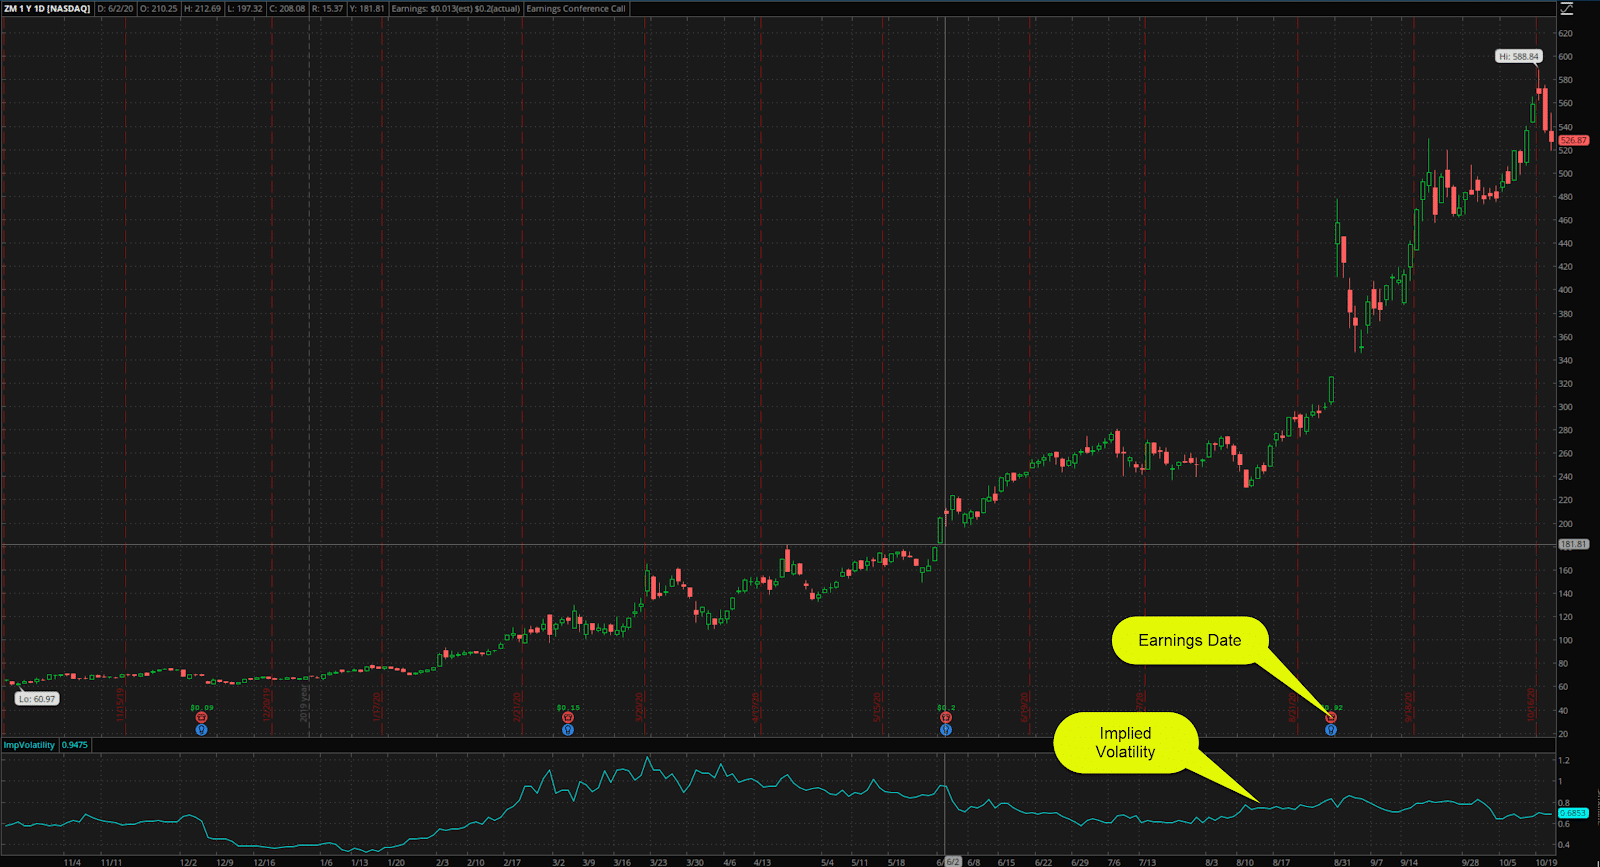
ZM Daily Chart
Even after we passed the March selloff, implied volatility remained elevated.
That makes selling options more lucrative.
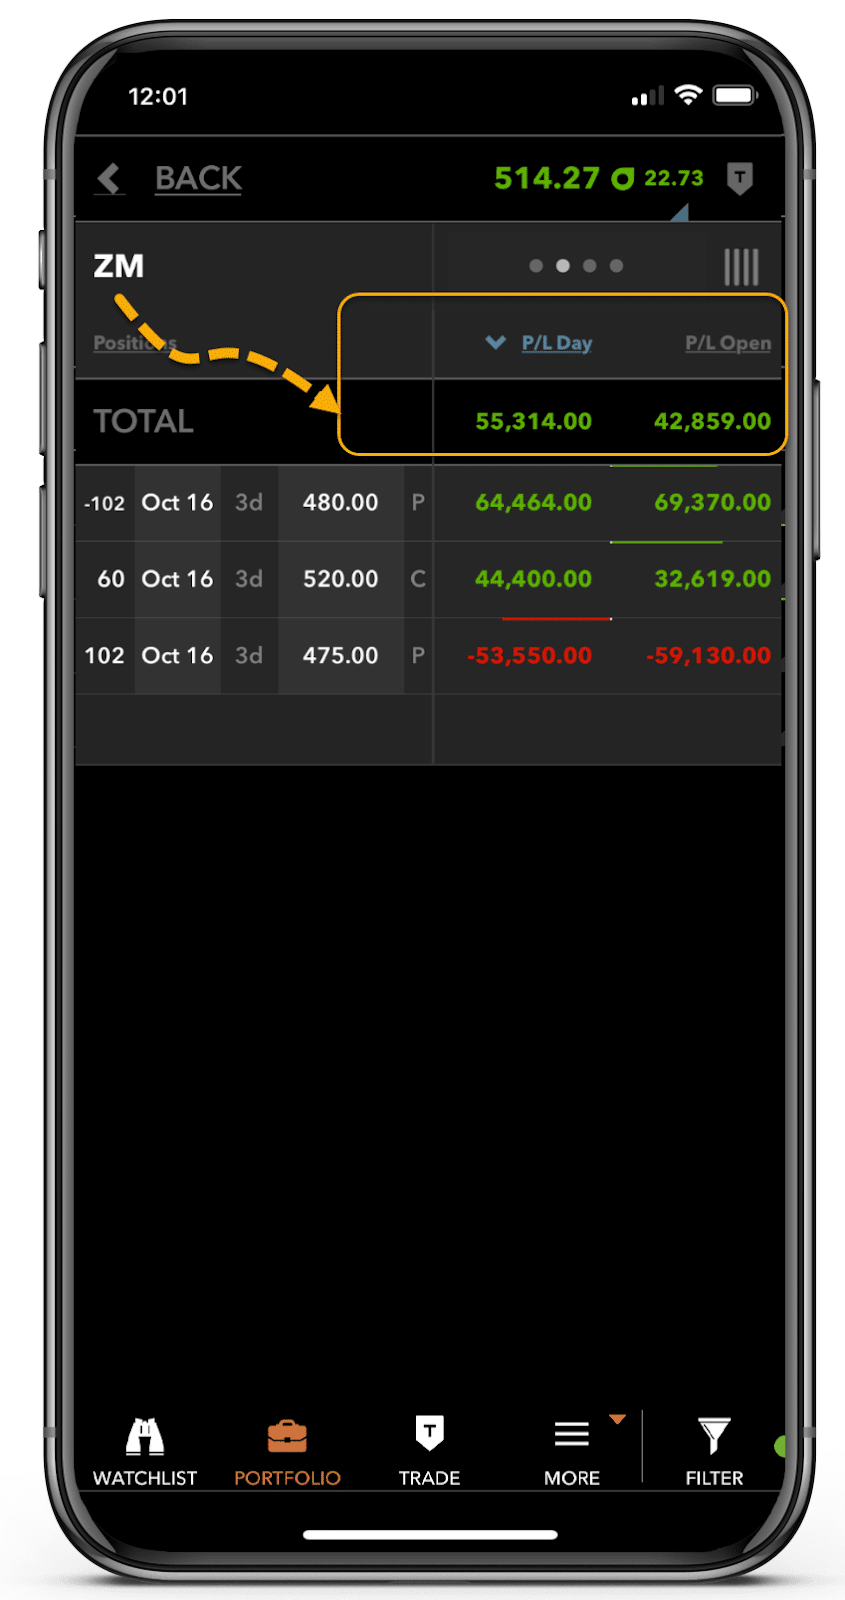
One of my favorite ways to do that is to sell a put credit spread.
You can see that in the iPhone graphic above.
ZM Hourly Chart
In this trade, I sold the $480 put and bought the $475 put for a net credit of $1.90 per spread, or $190 total.
My risk was the distance between the strikes less the credit, or $5 – $1.90 = $2.10 or $210.
As long as ZM stayed above those strikes by expiration, I got to keep the full credit as my profit.
When implied volatility is elevated, it lets me sell strikes further out-of-the-money and still collect a hefty credit.
Trades left on the table
Now, let’s dig into what you really want to know – what trades are out there.
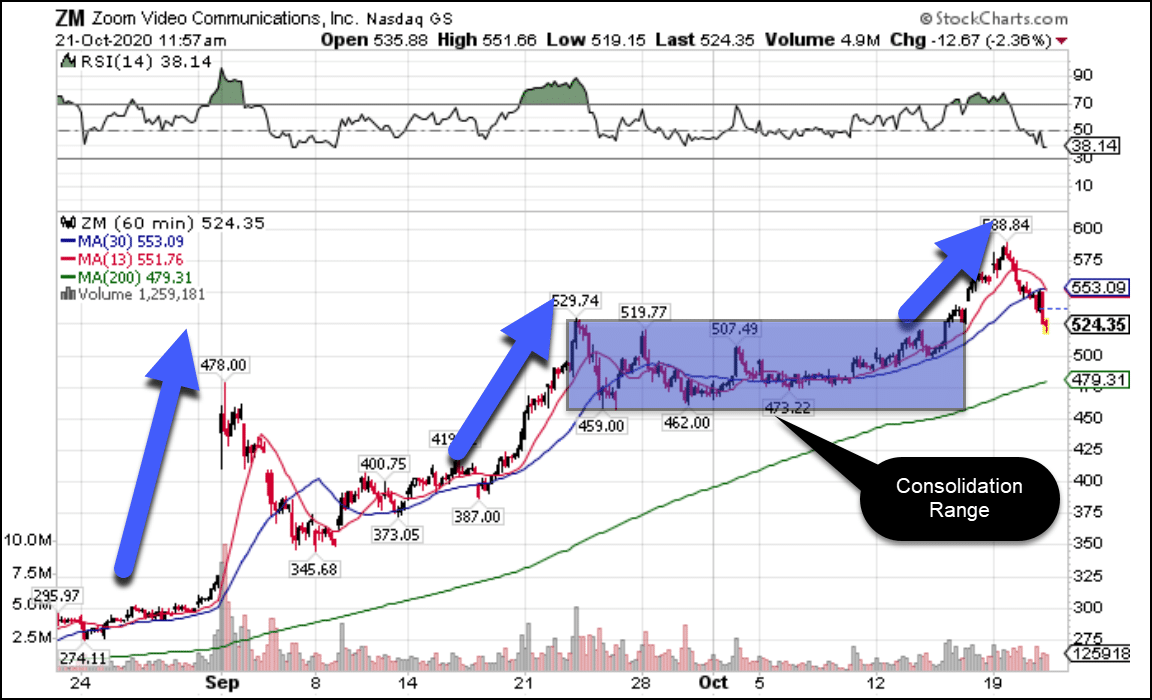
Let’s go back to the chart to frame this discussion.
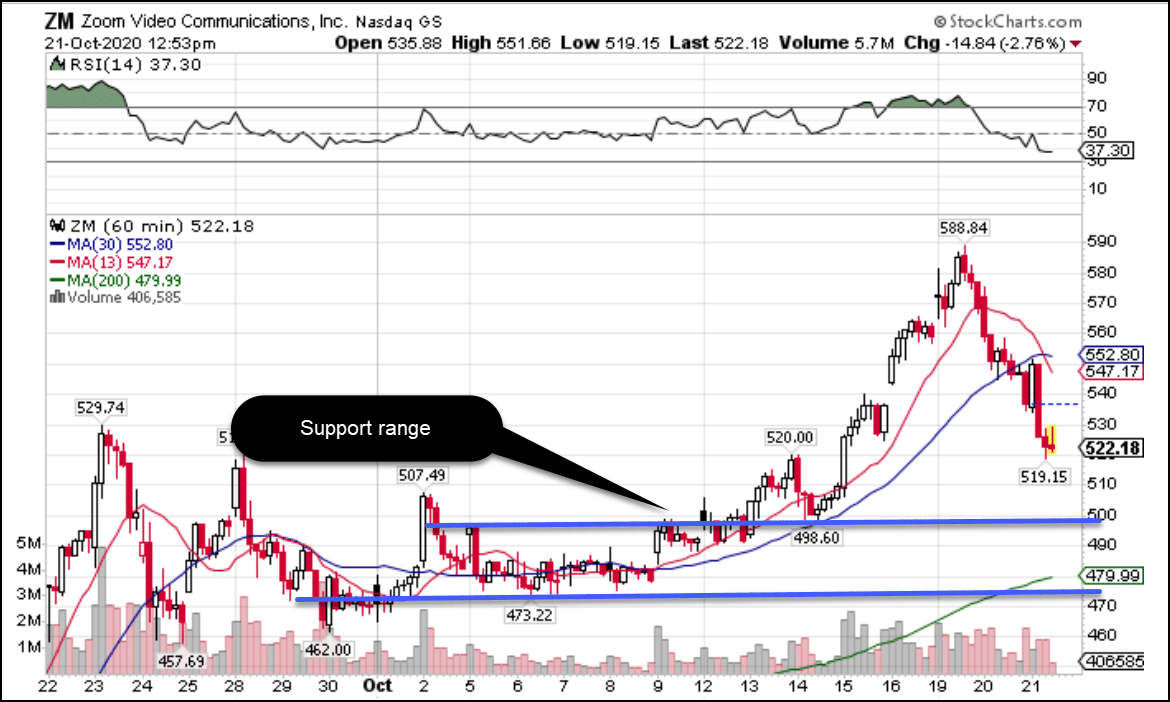
ZM Hourly Chart
Right now, shares are in the midst of a significant pullback.
The question is where they finally land.
I drew two lines that define a support area.
They encapsulate the majority of the consolidation range’s volume.
That’s where I expect the stock to find support.
What I don’t know is whether it bounces hard off those levels or simply stops and moves sideways.
Here’s how I would structure a trade around this idea.
I would use the upper level as a spot to start a small position. As price headed toward the lower line, I would add, getting to a full position at the bottom line.
My stop would be a close below the recent lows around $455.
Otherwise, I’d look at one of two plays.
The first would be buying straight calls to take a long position. While lucrative, this can be risky since implied volatility tends to decrease as stocks rise, giving me another headwind to deal with.
Most likely, I’d a put credit spread similar to what I did earlier, allowing me to take advantage of potential implied volatility contraction while also profiting even if shares trade sideways.
Now, before you start slinging options, take a moment to sign up for my Total Alpha Masterclass.
This option trading masterclass gives you many of the fundamentals necessary to find setups and create executable plans.