| The following article is a guest post from Ben Sturgill. Ben is going LIVE tomorrow at 2 PM ET to unveil The Power of One. It’s one of my favorite strategies for when markets get unpredictable like they have lately. It’s based on the same trade every day, but it has endless possibilities… |
We all love hunting down that next hot stock that delivers huge gains.
I do it in the IPO market, especially whenever I see an opportunity to strike.
But the conditions aren’t always going to be favorable for shiny stocks to be long on.
In choppy markets, some of them get ambushed and lop off the dollar value of our accounts.
That’s why I return every day to one setup that is repeatable, even when the markets are going nuts…
That setup is in the SPY, and it has a number of advantages going for it.
It’s among the most liquid names out there, making entries and exits a non-issue.
It provides daily opportunities to trade both ways.
Highly liquid option plays allow returns of 50-70%, even 100%+ a day.
None of these gains are ever possible without proper preparation and planning— both early in the pre-market and right before and after the opening bell.
Today, I’m sharing how exactly I get myself ready and execute on this time-tested strategy.
What I Look For In the Premarkets
Before we look at the charts, we need to understand the broader context— what is the big theme?
Because let’s face it…
There are other factors beyond what we’re seeing on the chart that can influence market direction.
A good way to get a sense of that is by checking macro-economic indicators.
Information is everything— and the more of it you can get about global markets, the more complete of a picture you’ll have.
Indicators can hint us at what is to come when the market opens at 9.30am.
As you well know, any fear and uncertainty in the other parts of the world — or extreme optimism, conversely— will cause a significant impact on the US markets.
Wouldn’t you want to be ready ahead of time?
Personally, I look at 5 in particular…
- Materials like crude and copper
- the VIX volatility index
- currencies, especially the Austrian dollar and the Japanese Yen
- he overall percentage gains of international equities
Then I tally them up, like I did before Monday’s trade.
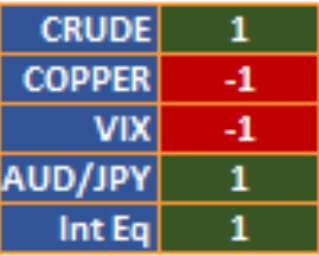
An overall positive score gives me a more bullish bias on the SPY, whereas an overall negative score gives me a more bearish bias.
Tune in here because I’m going to be unveiling something special about this at 2 PM ET tomorrow.
But this is day trading, and I like to be able to call an audible at the last minute.
In the end, the actual trade decision comes down to what I see on the shorter-term daily setups…
What I Look for Intraday
This is where things get exciting and I finalize my decision on whether to buy SPY calls or puts.
First I always have a look at the daily:
It gives me an idea of the underlying trend.
Generally, the trend is our friend, so more often than not I don’t want to go against it.
It also gives me a good sense of support and resistance levels.
Once I know those and can anticipate inflection points, I go into the smaller time frames.
Next, I look at the hourly:
It helps me determine short term trend, direction, and entry/ exit/ target/ stop prices.
More specifically, I look at the internals.
That includes the $TICK, the advance/ decline (ADSPD), and the VIX.
- The $TICK shows the buying and selling pressure.
If it’s staying above 0 indicating broader buying pressure, I’m leaning towards calls.
If it’s staying below 0 and indicating general market selling, I’d be more inclined towards puts.
- The advance/decline shows the ratio of advancing and declining stocks
If more stocks are advancing, that’s a bullish indicator. And vice versa.
- The VIX measures fear in the markets
When the markets crash, VIX rips higher. When the market moves up, VIX slides lower. Looking at where it is can give a great sense of whether we are in fear or greed mode.
Once I’ve looked at all these factors, I’m ready to place the trade.
The Trade
On Monday, the macro indicators were looking good, creating an environment I wanted to be long on.
On the chart, we had some short term momentum and longer term momentum in our favor.
We also had a bull flag chart pattern setting up.
In retrospect, here’s what we see on the 3-day chart with hourly bars, based on Monday’s trade…
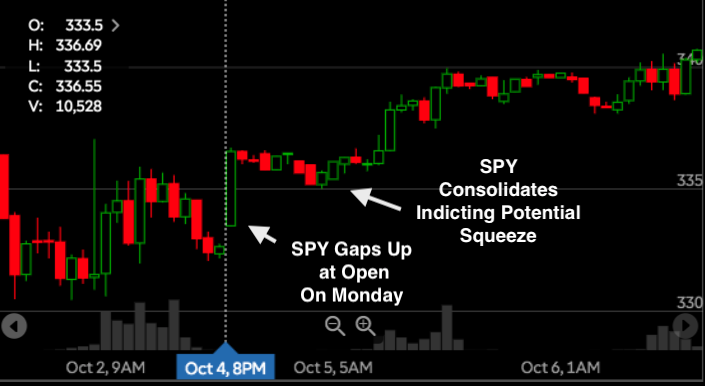
As far as our internal indicators, the TICKS remained strong, the advance/decline showed more stocks were up, and the VIX was coming down.
For that reason, I went ahead and alerted SPY calls for my trade of the day.
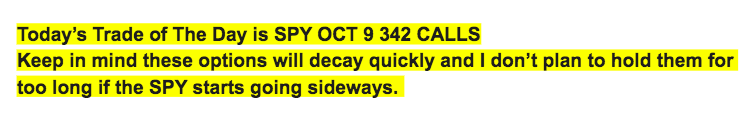
It turned out to be a big winner. I got in at 1.30 and out 1.95— all for about 50%.
Tune in for My LIVE Event Tomorrow
Sometimes all it takes is one trade a day— like the one I just described— to have success in these markets.
In fact, making more trades could be riskier.
That’s why I’m about to unveil my Power of One strategy.
I’ll reveal how I set up my daily trade for huge upside potential (but never lose more than my initial stake).
Register for my LIVE event on Thursday, October 8th at 2 PM ET here.
