Have you ever looked at the performance of stocks compared to bonds?
When I sat down with JC Paretz on Monday, he threw up this simple chart, and it blew me away.
Here’s a snapshot from our full interview.
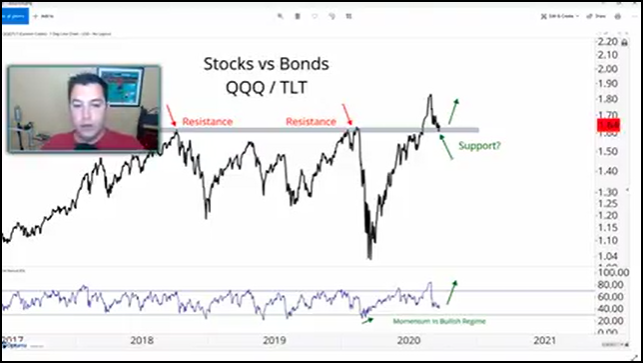
This chart represents the Nasdaq 100 (QQQ) to long-term US Treasuries (TLT).
And I want to explain why this concept is so powerful to trading.
Because as JC explained, this ratio can help identify market swings.
Before we get into the nitty-gritty, take a moment and watch our interview.
It lays out some profound ideas and he even gives away a few stock picks.

Click here to watch our interview
Now, let’s dive into how to read these ratios and some examples you can apply to your trading.
The Ratio Basics
As JC points out, the ratio of one asset class to another helps you understand relative outperformance.
For example, we can look at the Nasdaq 100 (QQQ) on the same chart as small caps (IWM) and see how much better technology has done.

QQQ to IWM Ratio Weekly Chart
Starting a little before 2018, this shows the QQQ outperformed the IWM nearly 2:1.
And that’s pretty incredible considering both are supposed to be risky assets.
What about those safety assets gold (GLD) and bonds (TLT)?

GLD to TLT Ratio Weekly Chart
This one’s really interesting because of its mean-reverting properties.
You can see how when one gets too far out of whack for more than a couple of months, it swings back in the other direction.
It also supports the general idea that gold is an inflation hedge when inflation is measured by US treasuries.
What This Means For Equities
Let’s go back to the chart JC showed us in the video.

QQQ to TLT Ratio Weekly Chart
Over time, equities outperform bonds. If I extended this chart further, you would see the gradual rise in the chart over time.
That makes sense because of the risk associated with equities.
Now, here’s a question posed by JC in the interview.
Who in their right mind would buy treasuries that yield less than 1%?
I want to take you back to the 1960s to give you some perspective on the current treasury prices.
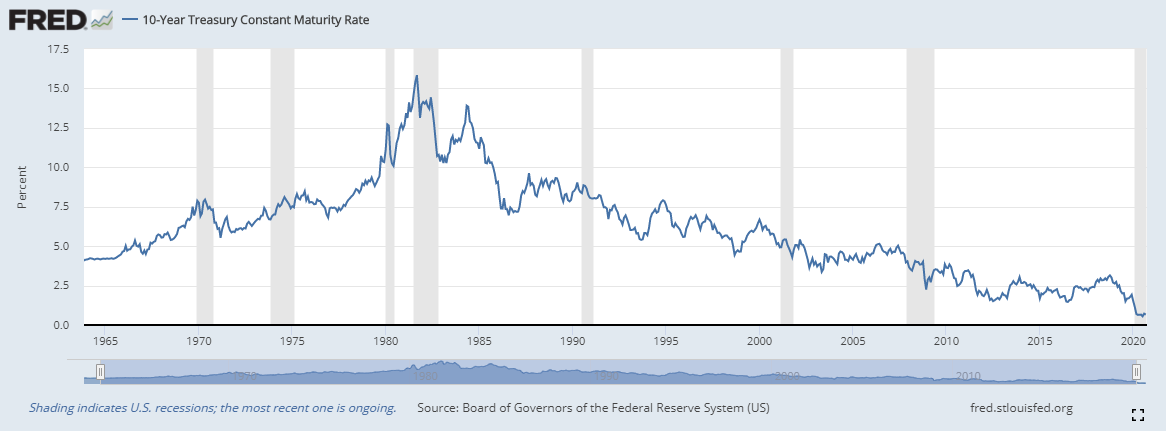
10-Year Treasury Yield
We aren’t just at all-time lows, we’re near zero.
And so far, the Fed hasn’t indicated it wants to break that threshold.
But even if it did, would you expect treasuries to outperform the QQQ?
That’s why we can look at the chart JC presented as a starting point for a medium-term view.
What the support level on that ratio chart says is investors and traders have allowed the gap between the two to close.
But, as long as that support level holds, they expect the QQQ to outperform treasuries.
Using the SPY as Validation
Now I want to look at the SPY vs the TLT to get a sense of where things sit for a broader basket of stocks.
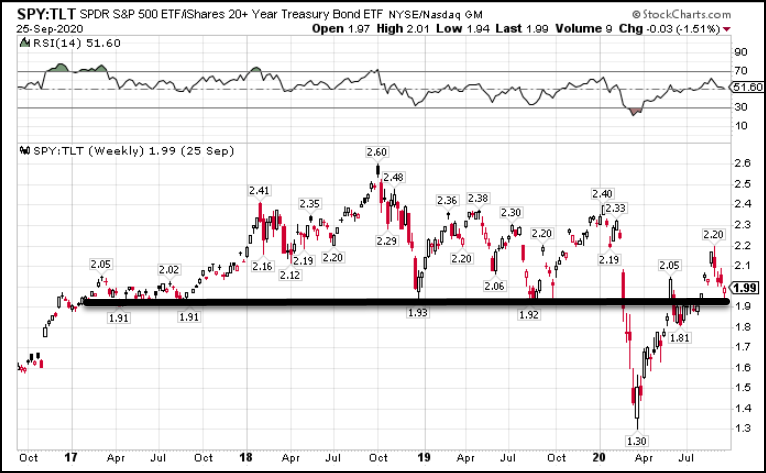
SPY to TLT Ratio Weekly Chart
This one isn’t nearly as bullish but isn’t bad either.
What I see here is a market that managed to stay above the drawn support line from 2017-2019.
With the recent selloff, it’s come back into that same area, just like the QQQ.
So I view this the same way.
As long as the SPY doesn’t start collapsing below this support area relative to bonds, then I believe markets can still run higher.
That’s not to say we can’t get selloffs here and there.
But we need sustained movement from stocks heading lower and bonds higher to really collapse this ratio.
And right now, I think it would be tough for bonds to rally much higher from here without the Fed explicitly opening the door for negative rates.
Interesting fact: Charts like these help explain why the Fed’s intervention in the treasury markets boosted stock prices.
Applying to my Trading Portfolio
With these charts, I can develop a portfolio bias for stocks.
For example, with stocks at the support levels on these charts, I’d start looking for a bottom reversal in stocks that coincided with a top in bonds.
Using that reversal as my stop, I could begin adding long call option plays on some of my favorite stocks.
Now, if you’re not familiar with call options, check out this quick training video I put together.