For some reason, the VIX and volatility has remained stubbornly high.
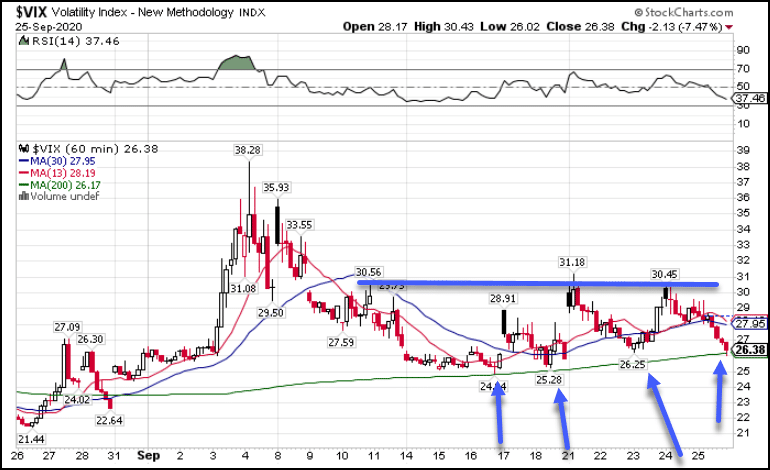
But there’s something curious when you look at the chart.

VIX Hourly Chart
Folks – this is a warning shot.
Every time the VIX ran into the 200-period moving average on the hourly chart, it bounced.
Yet, stocks only recently started sliding.
If you don’t know why the 200-period moving average is so important, take a moment to check out my Total Alpha Bootcamp where I explain why.
Using a cross-section of leading indicators, I’m going to make a case for why this could lead to much lower prices…but not in every sector.
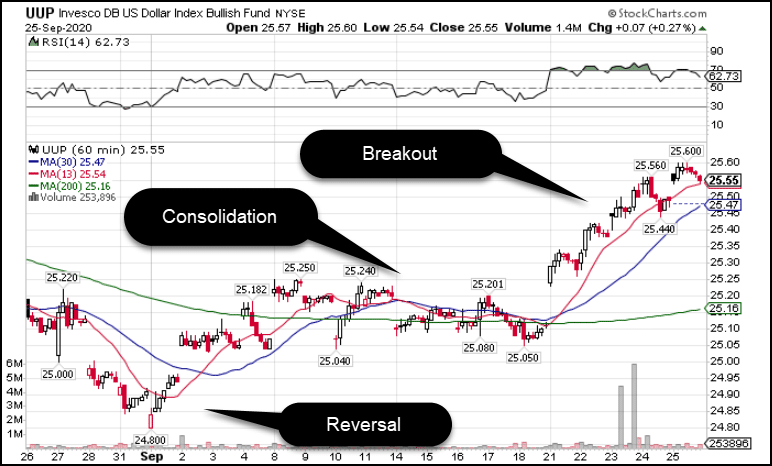
And I want to start with something I started watching recently – the US Dollar.
A dollar rebound
Most of August and September saw a lower US Dollar.
That led to ETFs like industrials (XLI) and companies like Caterpillar (CAT) outperforming the broader market.
All of that changed in the last two weeks.

UUP Hourly Chart
Making a substantial reversal, the dollar’s rise will hurt exporters and multinational companies – the very ones that benefited the last couple of months.
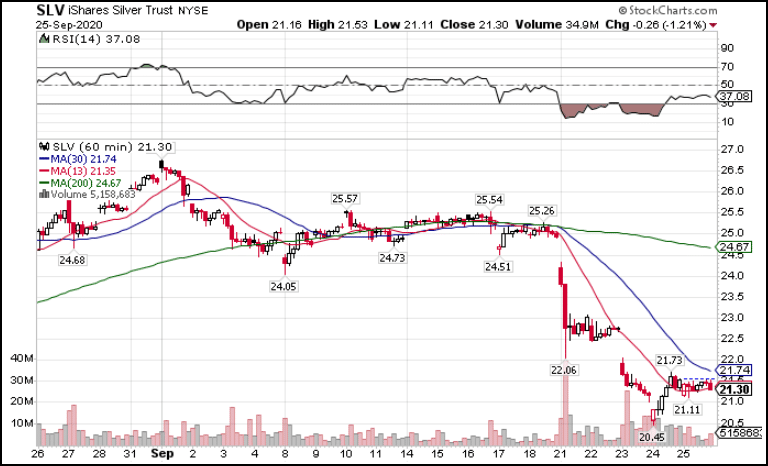
Even gold and silver felt the weight of the dollar as both crashed out from their near parabolic moves the month before.

SLV Hourly Chart
You can see how on the 21st, the dollar swung higher while Silver cratered on increased volume.
This leads me to believe there’s more to these moves.
And traditionally, a stronger dollar doesn’t bode well for US equities.
Which is why I see the combination of the dollar and volatility creating a perfect storm.
However, there are a few places that stand out as outperformers.
Homebuilding remains strong
Due to a combination of low supply and high demand, homebuilders continue to do extremely well in this market.
The XHB homebuilder ETF is not only set to outperform the broader market but could be poised for a breakout.
Take a look at the chart.

XHB Hourly Chart
While price traded in a wide range lately (all stocks tend to fall with big market drops), it’s managed to hold into the 200-period moving average.
And yet again, I cannot overstate the importance of this indicator in my trading.
See how price pushed higher through August to around $54.75?
When shares sold off, they kept making a series of higher lows, while that same resistance level held.
And all of this happened right around the 200-period moving average, which is no coincidence.
The broader market may fall apart. But, with a strong economic tailwind and a solid chart, I like this sector for October.
Just take a look at Lennar (LEN), one of the top-performing homebuilders this year.

LEN Hourly Chart
Again, price is riding the 200-period moving average higher.
Except this time it’s making a series of higher highs and higher lows.
All it needs is a little push for a breakout.
I could go on about more of the homebuilder and related stocks, but there’s another sector that’s silently built momentum, and lends itself to the lower equity market theme.
Bonds creep higher
With debt pouring out of the US Government, you wouldn’t expect treasuries to be in such high demand.
Yet, unbeknownst to many traders, the TLT ETF snuck higher through September.

TLT Hourly Chart
There are two important items here.
First, we again have the 200-period moving average. Except this time, price has traded over it.
Second, the blue trendlines connect the highs and lows of the candlesticks.
You can see how the price range is narrowing and moving higher.
Both of these are bullish in my book and should lead bonds to take out the high in September.
Since bonds typically trade opposite stocks, I see this as a potential catalyst for another selloff.
Now, before you start grabbing every short in the book, I need to show you what I expect for this week…
…because I think we’re set to bounce first before the next drop.
Why a bounce is in the cards
I want you to look at a chart of the SPY and see what stands out at you.

SPY Hourly Chart
There are two things that jump off the page to me.
First, there’s space to run back up to the 200-period moving average.
Second, the 13 and 30-period moving averages are poised to make a bullish crossover.
With both of these in place, I expect markets to stage a big of a rally first before the next selloff.
That’s why I’m coming into this week with a light portfolio and waiting for the market to make the first move.
Is volatility good or bad?
If markets start making large swings, volatility will pick up.
But is that a good thing?
The following video has the answer.

