Shares of Tesla ran higher right into Battery Day despite broader weakness in tech.
Anyone who hopped on this train earned a shot at some serious profit potential.
Now that Battery Day has passed, I’m on the hunt for hot new trades.
And no, that doesn’t mean I stopped looking at Tesla (TSLA).
I know, it’s getting rocked now, and trading under $400 per share.
But I see two potential setups here.
Both of them have the potential to make some serious $$$$.
Let me show you what I’m looking at.
The reversal trade
Who doesn’t love to brag to their friends about hitting the low tick?
You know why they call it catching a falling knife?
Cause most folks just get cut to ribbons.
Reversal trading isn’t easy.
In fact, I’d say it’s one of the hardest ways to play the market.
But it can lead to some fast market action and humongous moves.
I look for the most likely spots for this to occur – support levels.
Support levels are price points where buyers are more likely to step in.
That doesn’t mean they’ll turn the stock around. If there’s intense selling pressure, it can overwhelm buyers.
It just makes it more likely.
There are two places that I see this as more likely to happen than most.
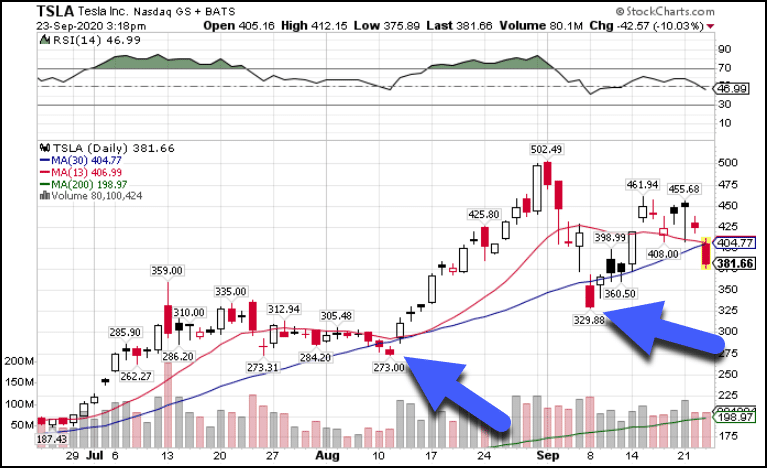
Blue arrows point to two levels.
The lower left one is the close/swing low before shares took off on their last run higher.
You can see how the stock traded in and around this area for nearly a month. That’s indicative of accumulation.
If price falls rapidly to that point, chances are some of those buyers will step in trying to scoop up some more shares.
The other support area is the swing low shown by the swing low created in early September around $329.89.
In and around that area I would look for a possible reversal.
When I look for reversals, I use the intraday chart, specifically the hourly chart.
Within that, I search for different signals for the turnaround.
As those signals compound on larger time frames, I get more confidence in the trade.
Continuation pattern
The continuation pattern is a fairly textbook style trade.
In general, I want to see a strong move higher. After that, price should trade sideways in a contracting channel.
You can see below how that worked out with the blue lines.
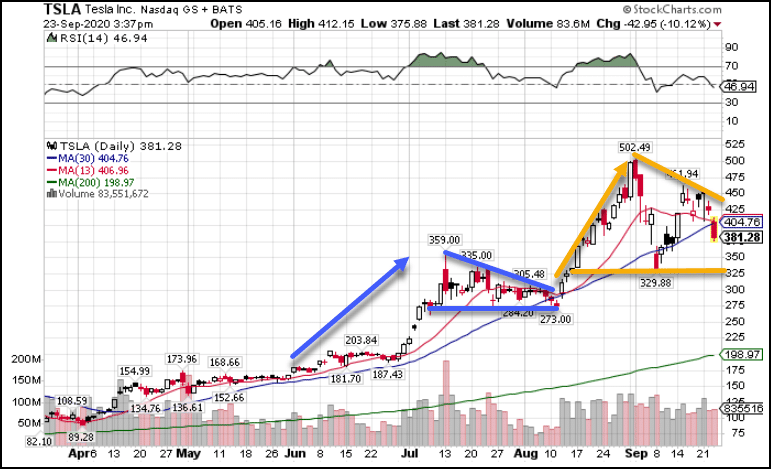
Using the solid blue lines, I connected the highs and lows of the candlesticks to create the boundaries of the chart pattern.
Since the lines converge on one another, that tells me price should expand out of that range soon…which it did.
The current setup (using the orange lines) isn’t nearly as clean. However, it still follows the same basic principals.
In fact, I can put it together with the previous strategy to look for a reversal off the lower swing point when the lines start to converge.
That’s like hitting a double whammy.
Money-pattern
Lastly, my favorite setup is my ‘money-pattern’ which is the foundation for many of my High Octane Option trades.
The money pattern occurs when the 13-period moving average crosses the 30-period moving average.
You can see below where this happened previously, preceding a strong move higher.
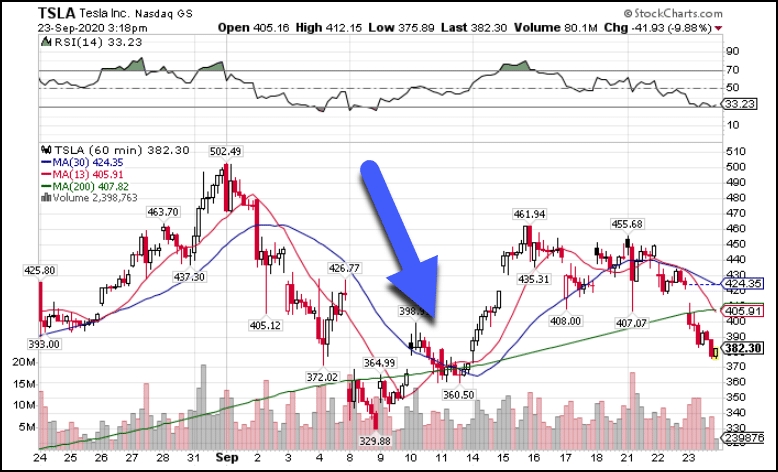
Currently, the trend is pointed lower.
However, if price turns around and creates a crossover in the other direction, I can use that setup to pick up some long calls.
What’s neat about this setup is it works on the hourly timeframe instead of the daily. That means I can use short-dated option contracts which tend to cost less for the same strikes.
Practice first
Any of these setups aren’t unique to Tesla.
In fact, they occur on many charts going back years.
Take some time to find them in other stocks and see how they work. Get a feel for them and see if one of them feels better.
Ultimately, you want to be comfortable with whatever strategy you choose.
Now, a great way to cut down on the clutter and zero in on setups like my money-pattern is with my High Octane Options scanner.
During the trading day, this scanner looks for money-pattern crossovers and streams the results to members live.
It’s a great way to not only see the trades I’m making, but cultivate another source for ideas.
Click here to learn more about High Octane Options.
