JC Parets is known throughout Wall Street for his incredible insights.
I’m highlighting his work in this week’s Intermarket analysis because it is so timely.
As he prepared for his live event this Wednesday, I asked him for his thoughts on the market.
What he said blew my mind because IT WAS SO OBVIOUS!
Tech may have grabbed the headline…
But materials, industrials, and even transports shot higher unnoticed.
Names like Freeport MacMoran (FCX) moved over 200% from the March lows, gaining nearly 25% since August.
And he thinks we may just be getting started.
I already used his insights to lock in some nice gains in Caterpillar (CAT) a couple of weeks ago.
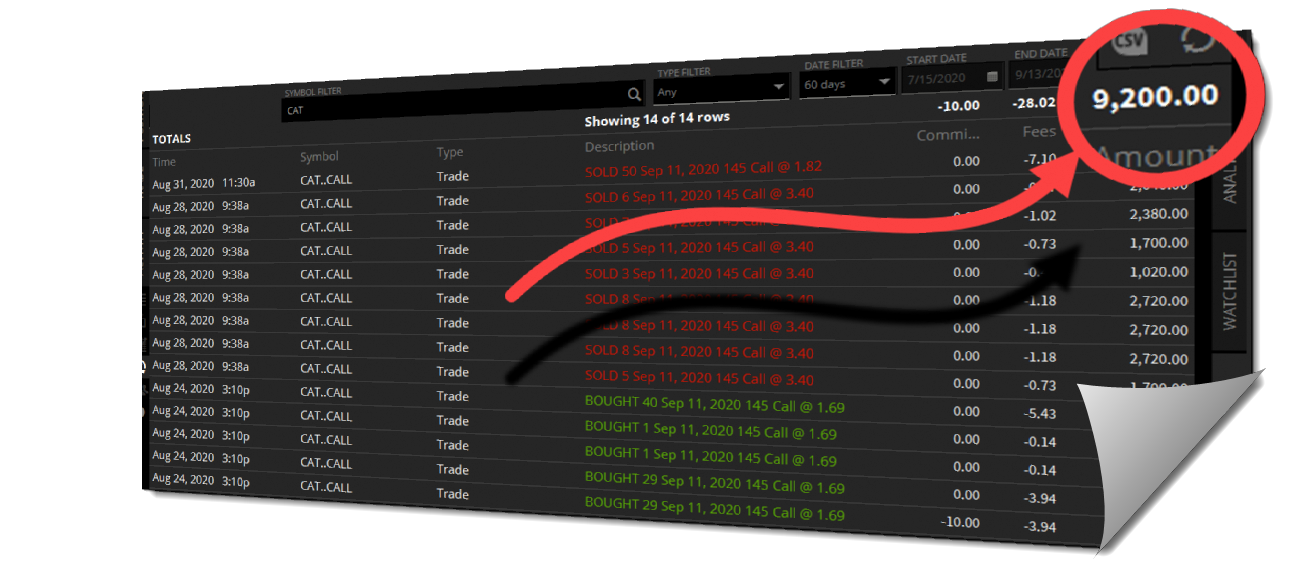
One of my favorite stocks to trade lately in High Octane Options*
*See disclaimer below
But I wanted to know what he saw for this week.
And this is what he told me…
Look for relative strength
My first question was whether the materials, industrials, and transports could move higher.
His response – of course!
While the rest of the market fell apart, these sectors showed a lot of relative strength.
In fact, a few of them posted some pretty sweet gains on Friday.
Take a look at the XLI industrials ETF.
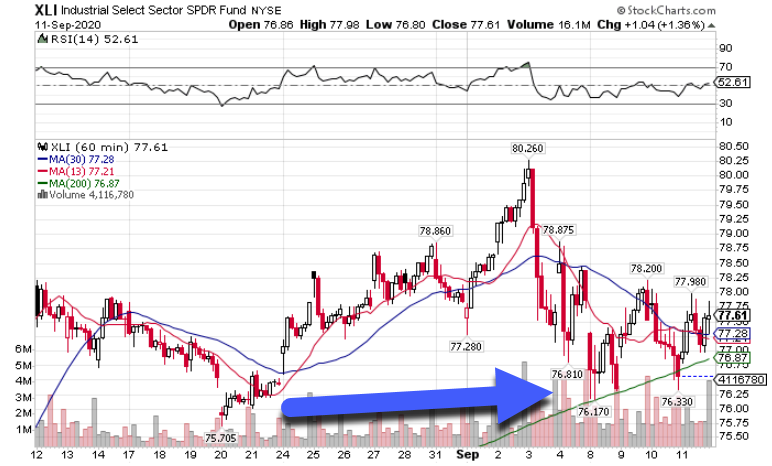
XLI Hourly Chart
At first glance, it doesn’t wow me.
But, when I compare it to the QQQ tech ETF, I see how it held up much better.
And then I spotted something really interesting.
Check out the green line on the chart.
That’s the 200-period moving average, AKA the gravitational line.
The XLI managed to ride this line higher over the course of a couple of days.
Every time it tried to slide under, buyers propped up price, creating some sweet looking charts on individual names.
Take a gander at Deere (DE).
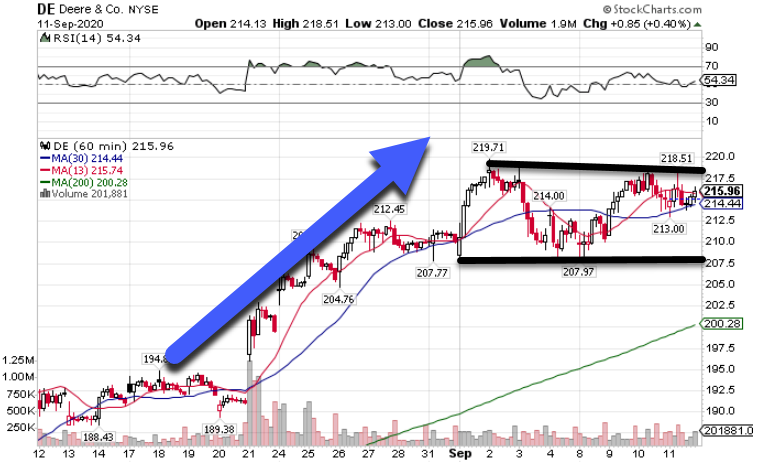
DE Hourly Chart
We all know the world economy sucks, blah, blah blah.
No one told Deere.
After launching higher in August, shares began trading in a range of $207.5-$220.
Below that, you can see the gravitational line creeping up.
The longer the consolidation runs, the more likely it is to explode out.
Considering how poorly tech has been, I’d rather look to these names for some juicy options trades.
But as JC pointed out, it’s not just about the industrials.
Transports have been on fire.
One company that straddles both worlds is Fedex (FDX), which was my Bullseye Trade of the week.
I wasn’t able to get into the trade, but man, I wish I had.
Just look at the chart.
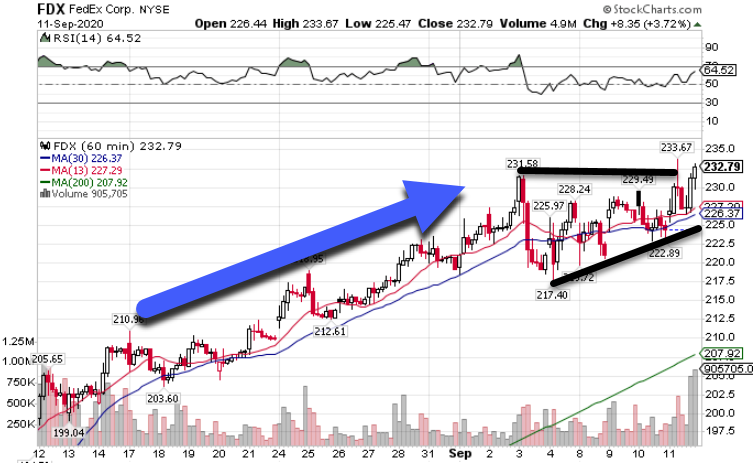
FDX Hourly Chart
I fully admit I had my head in Tesla and Apple. So I am thankful JC smacked some sense into me and told me to look at what was right in front of me.
But I still wanted to see what he thought about the tech wreck.
Turns out, we were on the same page.
Wait for the bottom
The last two weeks caused some serious damage in some of the tech names.
Just look at how sellers crushed the QQQ ETF.
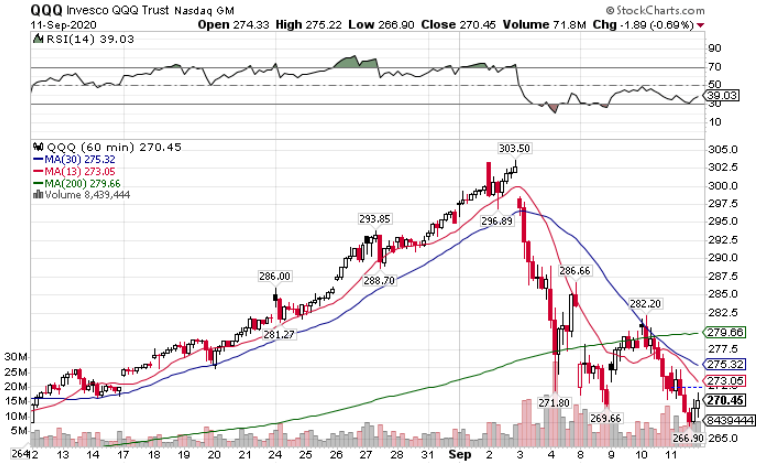
QQQ Hourly Chart
In case you weren’t aware, that’s a bearish chart.
We’ve got a moving average crossover, price finishing near the dead lows of the week, shares trading below the 200-period moving average…
Basically, nothing looks good here.
But, we should see a bounce soon.
Tech certainly got frothy. But that doesn’t mean it isn’t profitable.
Everyone from Facebook (FB) to Amazon (AMZN) posted fantastic earnings.
Yes, the pullback might be vicious.
But I expect it to at least bounce sometime in the coming week, even if it has further to fall.
Think of it this way.
All the Johnny-come-latelies bought near the top. Stocks need to reset themselves and drive these retail traders out of their positions before the uptrend can resume.
Until then, there are better places to play (like industrials) than trying to pick the bottom.
A darkhorse play
One area we didn’t cover extensively came up as I was writing this newsletter.
Gold topped out in early August, selling off hard to around $1950 an ounce.
Yet, it’s creating an interesting pattern worth keeping an eye on.
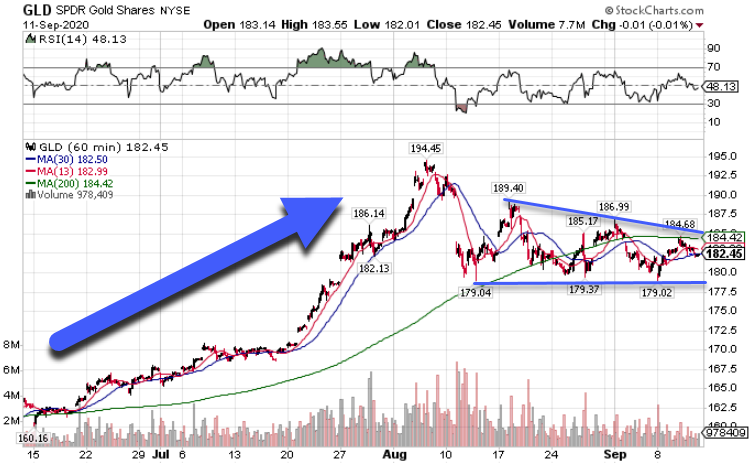
GLD Hourly Chart
The broader trend is still higher.
What I’m seeing now is a wedge pattern forming with a series of lower highs and equal lows.
All of this is happening around the 200-period moving average.
With the US dollar incredibly weak, this could be prepping for another move higher that would catch a lot of folks off guard.
Beware OPEX
WIth monthly options expiring this week, expect more volatility than normal.
Keep in mind that markets can whip around plenty intraday.
That’s why it’s important to keep perspective and step back.
Focus on data-driven decisions…just like JC Parets.
And join him for his exclusive event before it’s too late.
*Results presented are not typical and may vary from person to person. Please see our Testimonials Disclaimer here: https://ragingbull.com/disclaimer
