Why do traders look to the VIX for clues about the market?
Because it’s ability to forecast market changes is remarkable.
And what it’s saying now is ASTONISHING!
Allow me to decipher this codex because this isn’t something to rush.
Otherwise, you might miss the REAL opportunities.
Your jump on the week starts with a deep dive into the VIX.
For nearly a month the ‘fear gauge’ remained below $30…until now.
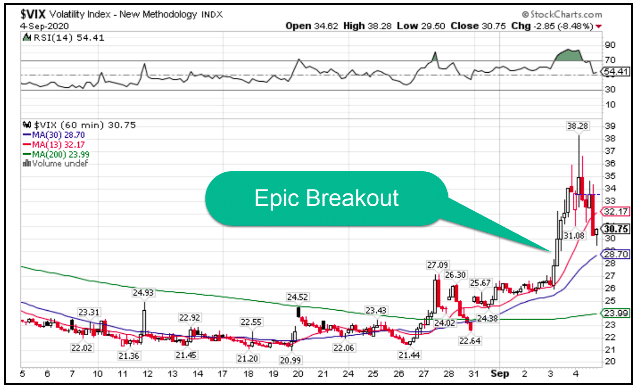
VIX Hourly Chart
Not only did the VIX soar just shy of $40, but it firmly closed above $30 to close out the week.
That comes as no surprise to anyone trading the big tech names.
At one point, the Nasdaq 100 was down over 10% from its highs…in less than 72 hours!
So what does the VIX say now?
Deductive logic
FAANG – Facebook, Apple, Amazon, Netflix, and Google. Throw Microsoft in there for good measure.
As the prices in these names skyrocketed, so did their influence in the S&P 500.
Let’s throw on our Sherlock Holmes hats and run through the facts.
- Every day they outperformed the rest of the market increased their weighting in the S&P 500.
- We know the VIX is a measure of expected volatility on the S&P 500.
- The VIX trades in the opposite direction of the S&P 500 the majority of the time – they have a -0.78 correlation.
- When they move in the same direction, it often means one is about to be very wrong
- Right before the declines last week, both were trading in the same direction
That means that options traders began buying protection against a decline in stocks – specifically big tech!
Why is it important to distinguish between betting against tech and stocks across the board?
Because while most of the world focused on their beloved Tesla or Amazon shares dropping…
They failed to notice the rise of the financials!
A not so secret secret
You see, while everyone watched their call options in Apple get annihilated, smart money bid up shares of bank stocks while betting against tech.
Compare a chart of the Nasdaq 100 ETF QQQ to the S&P Financial sector ETF XLF.
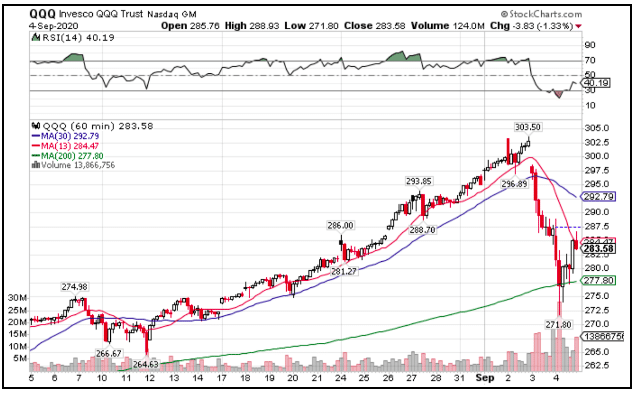
QQQ Hourly Chart
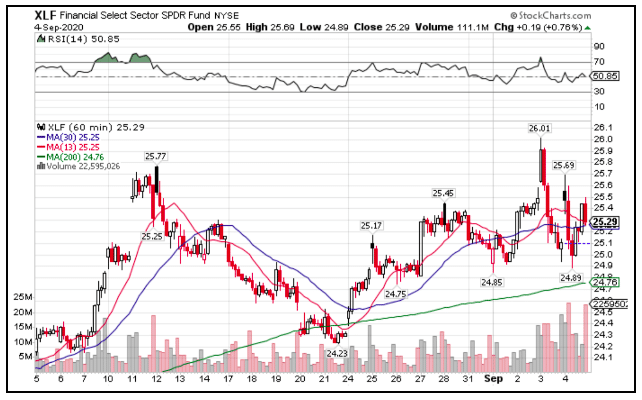
XLF Hourly Chart
Even if you never looked at a chart before, it should be obvious how much better financials performed in the last few days.
In fact, many traders expected this to occur as the economy improved.
Financials perform poorly in low-interest rate, bad economic conditions environments.
We know that the jobs picture continues to look bleak.
But, economic activity picked up in recent weeks.
And there’s some key data coming out this week that could be a boon for the banks and bomb for tech.
What I’m watching this week
While the Fed wants inflation to pick up, some are getting worried.
This week we get the Consumer Price Index data (CPI), a decent gauge on inflation.
The last two months came in pretty hot.
If the trend continues, markets might start pricing in a less accommodative Fed.
Considering they’re a huge driver for the recent rally in the mega-caps, that could quickly let the air out of the bubble.
As money searches for a home, I expect them to find their way into names like Goldman Sachs (GS), Bank of America (BAC), and the like.
One area that tends to get juiced is the regional banks.
Trader Tip – Watch the KRE ETF which tracks a basket of these companies. Quite often, it will act as the junior gold miners to the regular gold miners – provide a super boost.
Can one trade make the difference?
Take a look at the performance of stocks like Chewy (CHWY) and Peloton (PTON), both of which report earnings this week.
Prior to the pandemic, sell-side analysts dismissed them as gimmicks.
Today, their market cap is more than double a year ago.
And I’m eyeing both for another potential run this week.
But my best idea of the week will be laid out in full detail for members of Bullseye Trades.

Expected earnings dates listed in (…)
Stocks I want to bet against this week…
SC, DFS, PENN, IWM, SNAP, ROKU, SPOT, WK, ECL, TWLO
Stocks I want to buy this week…
MJ (none), DKNG (Nov 13), ZM (Sept 3), CVNA (Nov 4), CARR (July 30), GDX (none), RNG (Nov 2), NEM (Nov 3), CLX (Oct 29), RH (Sep 8), SHOP (Nov 3), JNJ (Oct 20), MSFT (Oct 28), TTD (Nov 5), GOOGL (Oct 26), FSLY (Nov 5), WMT (Aug 18), WORK (Sept 2), TWTR (Oct 27), AVLR (Aug 5), SQ (Aug 5), JD (Aug 11), NET (Nov 5), ADBE (Sept 25), MCD (Oct 27), COST (Oct 1), FB (Nov 4), PYPL (Oct 28), MTCH (Nov 4), ZEN (Nov 3)
This Week’s Calendar
Monday, September 7th
- Markets Closed For Labor Day
Tuesday, September 8th
- 6:00 AM EST – NFIB Small Business Optimism August
- 7:45 AM EST – ICSC Weekly Retail Sales
- 3:00 PM EST – Consumer Credit July
- 4:30 PM EST – API Weekly Inventory Data
- Major earnings: Abm Indus Inc (ABM), Coupa Software Inc (COUP), HealthEquity Inc (HQY), Seachange Intl (SEAC), Slack Tech Inc (WORK)
Wednesday, September 9th
- 7:00 AM EST – MBA Mortgage Applications Data
- 10:30 AM EST – Weekly DOE Inventory Data
- Major earnings: American Eagle Outfitters Inc (AEO), G-III Apparel Grp Ltd (GIII), HD Supply Hldg Inc (HDS), The lovesac Company (LOVE), Navistar Int’l Corporation (NAV), American Eagle Outfitters Inc (AEO), G-III Apparel Grp Ltd (GIII), HD Supply Hldg Inc (HDS), The lovesac Company (LOVE), Navistar Int’l Corporation (NAV)
Thursday, September 10th
- 8:30 AM EST – Weekly Jobless & Continuing Claims
- 8:30 AM EST – Producer Price Index (PPI) August
- 10:00 AM EST – Wholesale Inventories for July
- 10:30 AM EST – EIA Natural Gas Inventory Data
- Major earnings: Chewy Inc (CHWY), Dave & Busters Entertainment (PLAY), Peloton Interactive Inc (PTON)
Friday, September 11th
- 8:30 AM EST – Consumer Price Index (CPI) for August
- 1:00 PM EST – Baker Hughes Rig Count
- Major earnings: Kroger (KR)
