Rocket Mortgage is the hot stock of the week.
Shares nearly doubled since its IPO.
However, that doesn’t mean I don’t think it can run higher.
But with an earnings release set for tomorrow, it offers some challenges.
That’s why I want to go over each in detail until you understand them inside and out.
Even if I never use them, they are great lessons that apply to any chart.
Plus, I’m going to reveal my favorite options strategies to deploy.
If you never traded options before or are new to the game, then check out my Ultimate Beginners Guide to options trading.
Once you’ve got a handle on the basics, then you’re ready for these amazing setups.
Chart analysis
Rocket Mortgage’s chart isn’t as long as other established companies, so it looks shorter than normal.
That doesn’t mean the chart patterns and setups work any differently
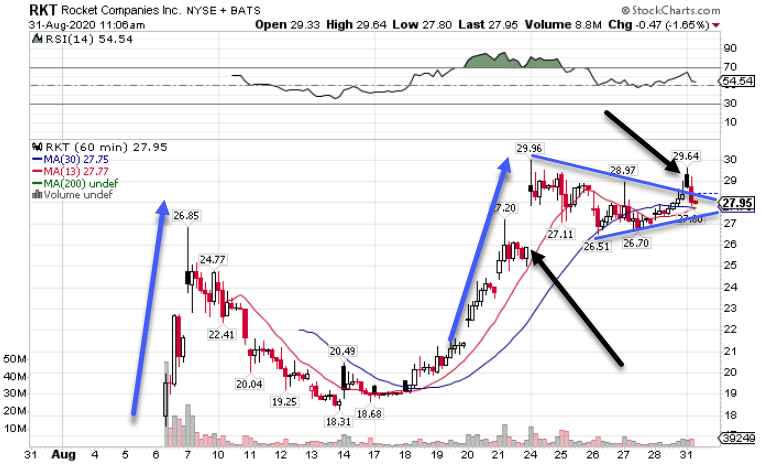
RKT Hourly Chart
Let’s describe what’s going on.
First, shares shot up off the initial offering and days of trading.
After the euphoria died out, price pulled back to near the original opening print. That’s a price where you’re likely to see big money come in and defend their positions.
Or even new traders trying to get in.
After it consolidated for a few days, we saw another big push higher.
That led to the current chart pattern that I drew out on the chart.
When I connect the tops and bottoms of the candlesticks with the solid blue trendlines, I notice a triangle shape forming.
That’s a common consolidation pattern I like to see. As long as price trades in a narrowing range, it often leads to an explosive move out of the pattern.
Note: Since this is considered a continuation pattern, the idea is that it would explode in the same direction as the trend, which is higher.
How do I know I’m wrong?
When shares start closing multiple hours or days below the swing low at $26.51, then I’d stop out.
My target would be a move above the recent highs by at least the distance of the current trading range for the pattern, which is about $3.50 above $30.
Trading strategies
As an options trader, there are a few different choices I have here. All of them interact with earnings differently.
My first choice would be to buy long call options.
I want to pick out strikes that go beyond the earnings date.
The reason for this is rather simple.
Option prices tend to increase as they approach earnings and immediately decrease shortly thereafter.
This is due to implied volatility, one of the main components that make up the price of an option.
When I buy a call option that expires AFTER earnings, the price of the option increases up until the earnings release.
That’s when I want to exit the trade.
If I hold onto the option through earnings release, implied volatility decreases, as does the price of my option.
By holding it up until the earnings announcement but not through, I take full advantage of the rising implied volatility. Selling it before earnings cuts the risk that the stock moves against me.
The other strategy I like for this trade is what’s known as a credit spread.
A credit spread involves selling one option contract at or out-of-the-money and then buying another further out-of-the-money to cap the risk.
It creates a payout graph that looks like this.
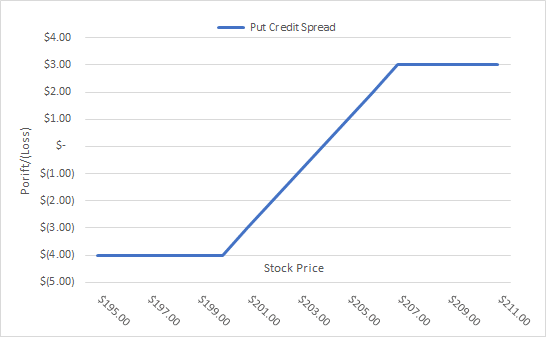
There are two types of credit spreads: put and call.
Put credit spreads are bullish bets the stock moves higher while call credit spreads are bets it moves lower.
What I like about these trades is that it caps my risk, which allows me to make a directional bet on the stock without losing my shirt.
Plus, decreases in implied volatility work for me.
So, I can initiate these prior to earnings and then hold them through the announcement to obtain the benefits of the implied volatility collapse.
You can learn more about credit spread examples in my latest blog post here.
Learn to combine chart analysis and options strategies
In my opinion, these are the two most powerful tools any trader can have.
Which is why I want you in my Total Alpha Options Masterclass.
Starting soon, my masterclass covers important topics like option fundamentals, portfolio allocation, how to choose the best option contract, and more.
It’s an educational experience you don’t want to miss.
Click here to register for my upcoming Total Alpha Options Masterclass.
