Markets aren’t cheap by any traditional measure.
But that hasn’t stopped bulls from trampling bears left and right.
If the SPY crests $339.08 and starts closing daily above that level…
Prepare for the mother of all rallies!
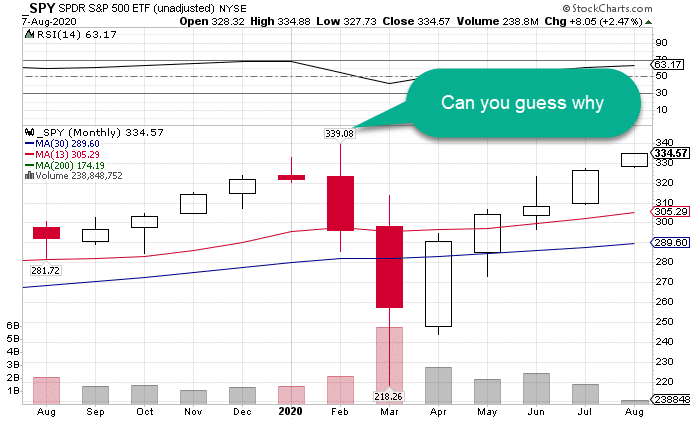
SPY Daily Chart
So far, it’s been technology that’s been leading the charge higher.
But one sector started a stealth comeback last week.
Heck, I didn’t even see it coming.
Nonetheless, if it’s got some real legs, it could shove stocks past the point of no return, causing shorts to dive for cover.
I’m talking about the financials!
Sensitive to the economy, everything from banking stocks to credit card companies should be struggling mightily.
So, are traders sniffing out a potential recovery that no one else sees?
To answer that question, we need to get a good cross-section of the market, looking at the bullish and bearish cases.
That will tell us exactly what we need to formulate our strategy.
Financial tale of two stories
On Friday, the S&P Financials ETF, the XLF, rallied 2.14%, while the regional banks ETF, KRE, jumped a whopping 4.42%.
How much do you think Visa (V) was up?
Down 1.21%!
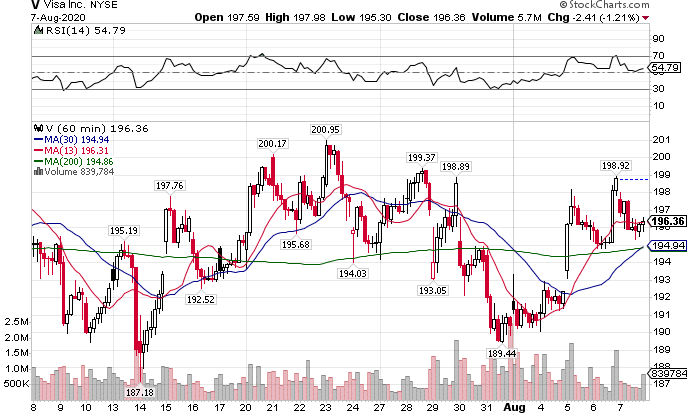
V Hourly Chart
Wait, wait, wait.
How can banks be recovering, but credit card processors, not reliant on anything other than transactions, aren’t rallying?
Part of that is they already made their move.
Visa (V) and Mastercard (MA) already got back to just below their all-time highs. So, they don’t have nearly as much room to recover.
But then we look at American Express (AXP), and things get a little more interesting.
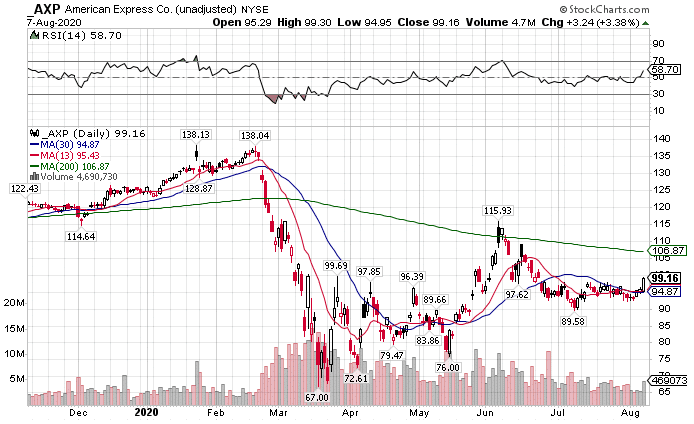
AXP Daily Chart
Why is it that American Express is lagging so much further behind the other credit card companies?
A lot of that has to do with its business model.
While Mastercard and Visa are mainly transaction processors, American Express acts more like a bank, carrying consumer debt.
And that’s the yoke around the banks’ necks that will keep them buried behind the rest of the stock.
As I noted yesterday, there’s huge amounts of consumer debt, be it household or otherwise, that’s lining up to fail.
Those failures don’t hit credit card processors. They hit the debt holders – the banks.
That’s why these companies can’t seem to catch a break when technology keeps pushing higher.
It leads me to one inescapable conclusion – the bank rally is garbage.
Sure, it can push higher. But fundamentally, these companies are in trouble.
Not just this year.
But next year as well.
Rather than try to catch the bounce here, I’m looking at the best performing major index from last week, small caps.
Tiny companies. Big moves.
Before the pandemic exposed the division in corporate health, small-caps lagged far behind their large and mega cap counterparts.
The Russell 2000 ETF the IWM struggled to get back to its all-time highs for all of 2019.
Since the selloff in March, they haven’t been able to keep up with their technology brethren.
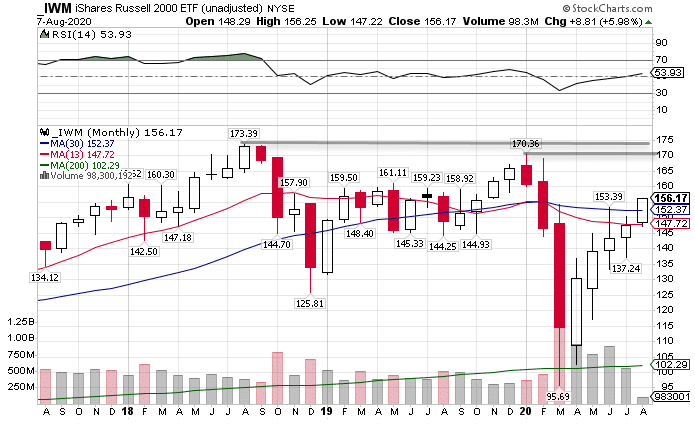
IWM Monthly Chart
In fact, they have to beat out the 2019 and 2018 highs to set new all-time highs, no small feat.
Yet, they finished last week near the dead highs.
When that happens, it’s typically a technical sign that they’ll continue to rally the following week.
Take a look back through the years on major indexes and find wide-body candles that close near the highs or lows and see how often the next week follows through. I bet you’ll be amazed.
While that might have been the case for gold, I’m starting to question whether it will hold up next week, along with silver.
Dollar dilemma
For weeks now, the U.S. dollar has fallen hard, helping fuel a rally in the precious metals.
Yet, both showed signs of slowing down last week, or at the very least taking a pause.
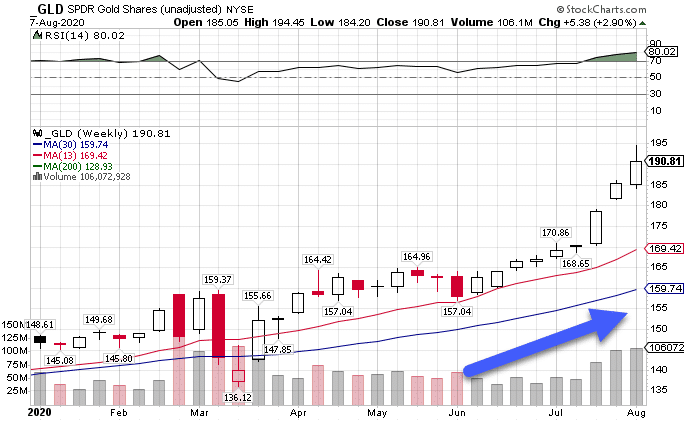
GLD Weekly Chart
Notice how volume keeps increasing, yet, the GLD ETF didn’t finish near the highs the last 8 weeks (more or less).
If we see a similar pattern this week where volume increases but a lower high, or a higher high on lower volume, that could signal the bulls are spent.
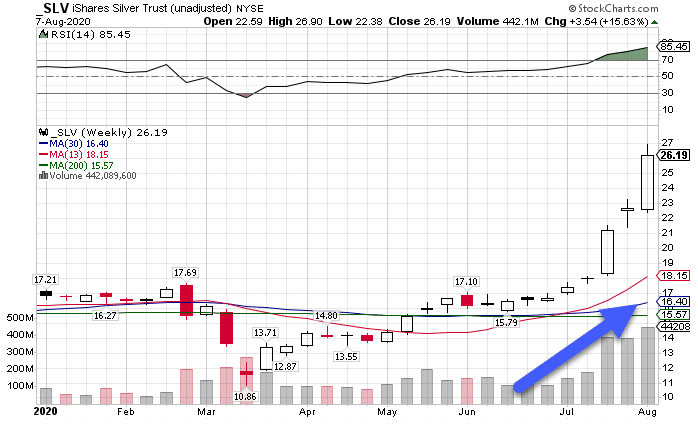
SLV Weekly Chart
The silver chart looks more bullish as the ETF closed closer to its highs on rising volume.
More than likely, we’ll see gold decline prior to silver.
So, if you miss the trade on gold, you might get a second shot with silver.
One odd little duck
Out of all the markets I looked at, one didn’t jive with the bulls.
I’m talking about the VIX, which measures implied volatility or option demand on the S&P 500.
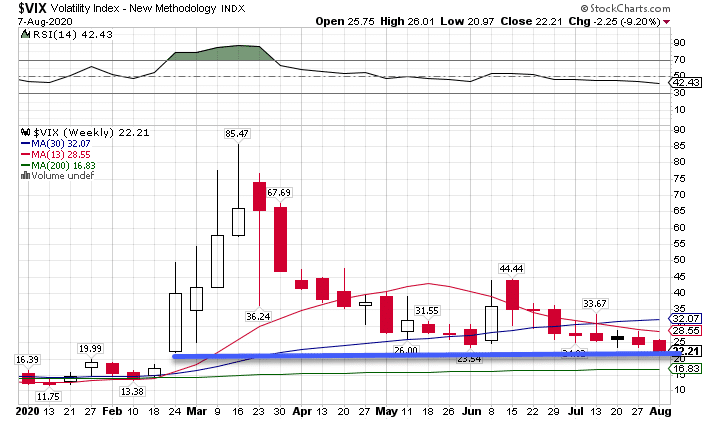
VIX Weekly Chart
It’s tough to tell from this view, but the low of the first large up candle back in February is $22.
Last week, the VIX pierced that level and bounced back to close at $22.21.
That tells me someone realized volatility was getting too cheap.
And that could mean we’re in for a turn in equities in the coming week or so.
How I plan to make a move
There is one stock, in particular, I want to short.
It’s a big name that most people think I’m crazy for suggesting.
Yet, I think it could turn out to be one of my biggest trades of 2020.
And that trade will be reserved for my members.
But there’s still time for you to join and see when and how I plan to enter and exit this trade from start to finish.
All that starts with preparing yourself with my Total Alpha Options Masterclass.
Here you’ll learn the tools and techniques that I use to trade the markets to this day.
The same ones that I plan to use for this epic trade idea.
Click here to register for my Total Alpha Options Masterclass.
