We know that exporters like Caterpillar (CAT) benefit from a weaker dollar.
Certainly gold enjoys this trend and does its forgotten sibling— silver.
Yet, most of us overlook homebuilders…
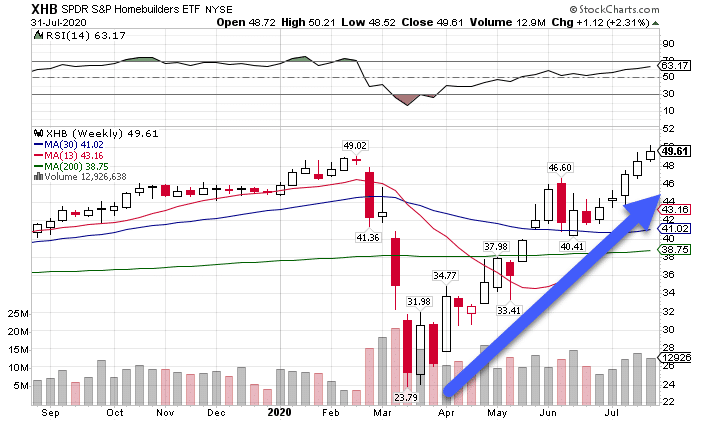
XHB Weekly Chart
Even with home prices dropping 3% in some areas, many experts believe overall that they’ll jump by more than 10% next year!
Looking at this, you probably think the best is behind us.
How wrong you are.
In fact, I think this trend is about to reset for another leg higher.
But it harbors a terrible secret!
One that it doesn’t want you to know.
But I don’t care what it wants, because I’m going to share it with you.
Build on this trend
Homebuilders have several tailwinds in their favor.
As I noted earlier, the lower dollar benefits the sector. In fact, it helps most hard assets from commodities to…you guessed it, real-estate.
What’s interesting are how the different pieces within the sector have performed.
Take the luxury end of the market with Toll Brothers (TOL). It’s one of the few not near its highs.
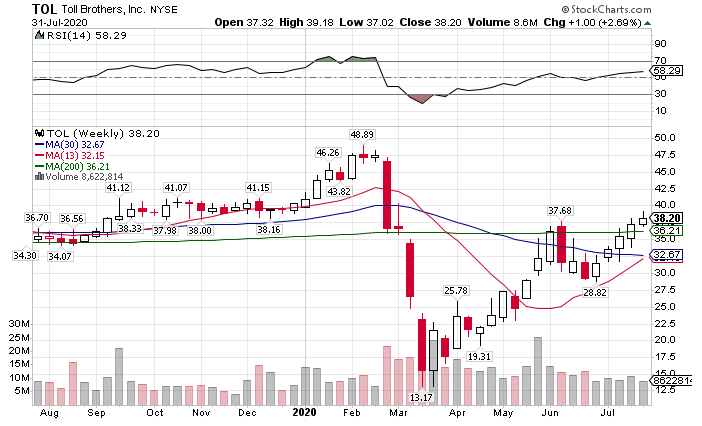
TOL Weekly Chart
This stikes me as somewhat odd considering how concentrated the wealth creation has been in this last market run.
In fact, it’s the broad-based builders like D.R. Horton making new highs.
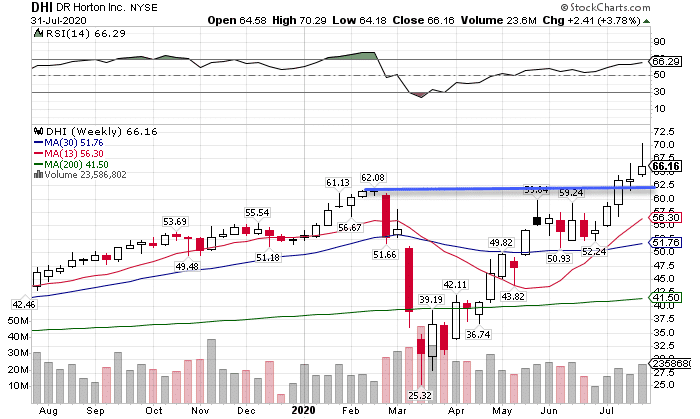
DHI Weekly Chart
You’re probably wondering what that blue line is there.
That’s the old all-time high at $62.08.
When price comes back into that level, it should act as support for a nice trade idea.
Beyond that, the recent breakout area between $52-$60 is a great spot for bulls to add a position.
Why?
Because you can stop out with a close below that clearly defined range.
It’s so much easier to have the charts tell me where to stop out then trying to guess, don’t you agree?
Something you probably didn’t know about the Homebuilder XHB ETF…it’s not just about homebuilders.
Rather, this crazy little ETF’s top holding is…Whirlpool (WHR)!
Yes, a homebuilder ETF’s top holding is a washing machine company.
Its third-largest holding is Carrier Global Corp. (CARR), manufacturer of heating and cooling units!
Dig deeper into the ETF and you’ll find quite a lot of this.
So, if you want pure plays on the homebuilders, I find it’s better to go with the specific companies themselves.
Financials still lag far behind
Want to know how I know the economy still sucks?
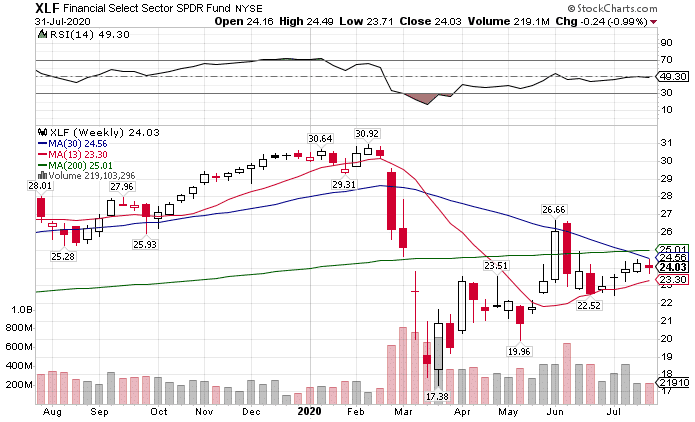
Take a look at the financials ETF the XLF.
XLF Weekly Chart
These stocks made back a little more than half of what they lost, but that’s paltry compared to technology.
Banks live and die by economic activity and interest rates. Both of those are in the toilet at the moment.
As long as the Fed keeps its foot on the money supply gas, these stocks are going nowhere fast.
When they do finally start to move, that will be a sign a REAL recovery might be taking hold.
Until then, it’s all funny money window dressing.
Did you see gold?
Want to see something really cool?
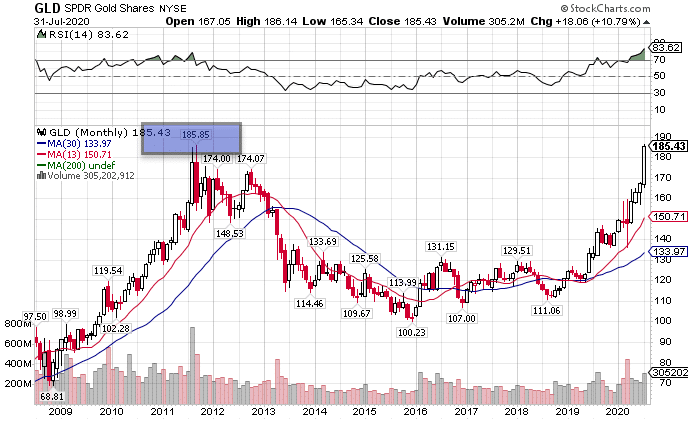
Take a look at the following chart of the GLD.
GLD Monthly Chart
I highlighted the high from way back in 2011 of $185.85.
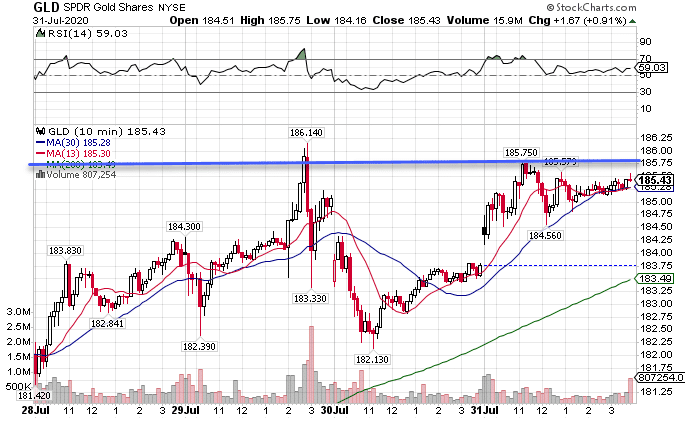
Now, let’s look at what happened when we hit that level this past week…nearly a decade later.
GLD 10-Minute Chart
If anyone ever tells you that technical analysis doesn’t work, you show them this example.
Now, is there more left in this trade?
Well, weak charts don’t typically close right near their monthly highs, so I’d go with yes.
Plus, gold futures topped $2,000.
We might see a little pullback to start this month, and even if gold starts running higher, it will need to take a breather soon.
But unless the dollar pivots, which it might, then who knows how far this trade can run.
Ride that tech train
Why fight a good thing?
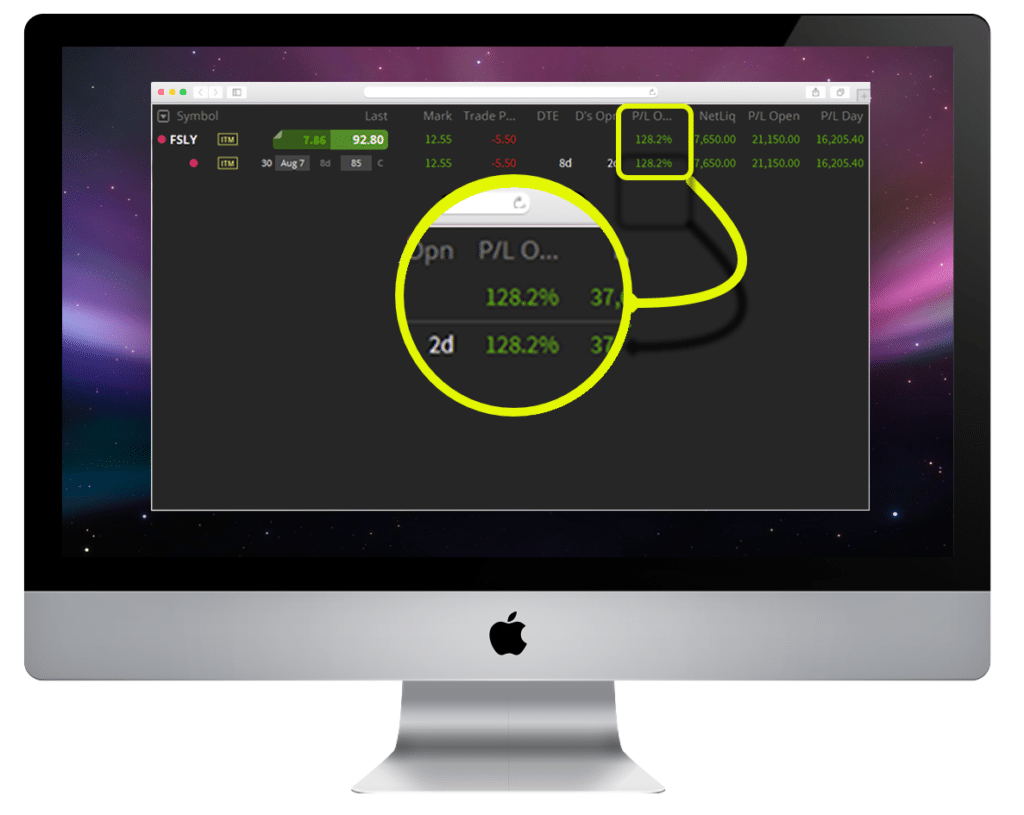
Last week, I scooped up a massive trade in Fastly (FSLY).
One of my best High Octane Options trades yet!*
*See disclaimer below
This trade taught me a very important lesson that I forget at times – don’t fight the trend.
When I tried betting against Shopify, I got slaughtered.
Same thing goes with Apple.
And if I had been a better man, I might have learned my lesson earlier.
But I fought the losing fight with the dunce cap on.
Now, I’ve seen the light.
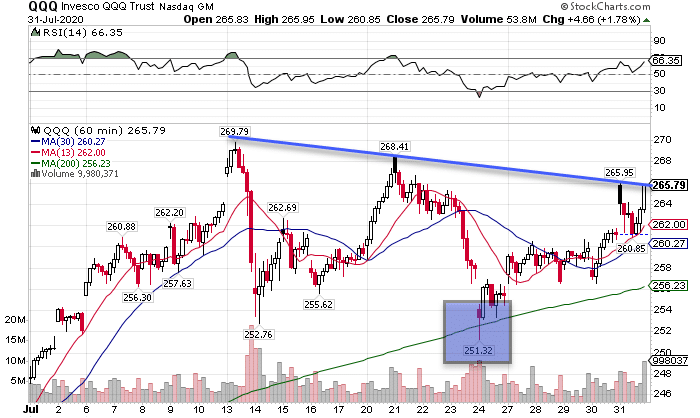
Looking at the Nasdaq 100 QQQ ETF, I think the party is just getting started.
QQQ Hourly Chart
We just bounced off the hugely important gravitational line on the hourly chart.
All that stands between the bulls and glory is making another jump over this trendline resistance.
And that looks all but inevitable.
Which is why I’ll be looking at some momentum names this week for my High Octane Options portfolio.
Names like Adobe (ADBE), Carvana (CVNA), and even…Shopify (SHOP)…but to the long side this time!
There’s still time for you to get in on the action.
High Octane Option members get access to my live trading account, my daily watchlist, and market outlook, as well as my proprietary scanner.
All aimed at delivering option plays that hit double and triple-digit percent gains!
You will never be wanting for trade ideas again.

