Alright, so let’s start with the hard part – the loser.
I marked up an hourly chart of FSLY to give you the basic rundown of what occurred.
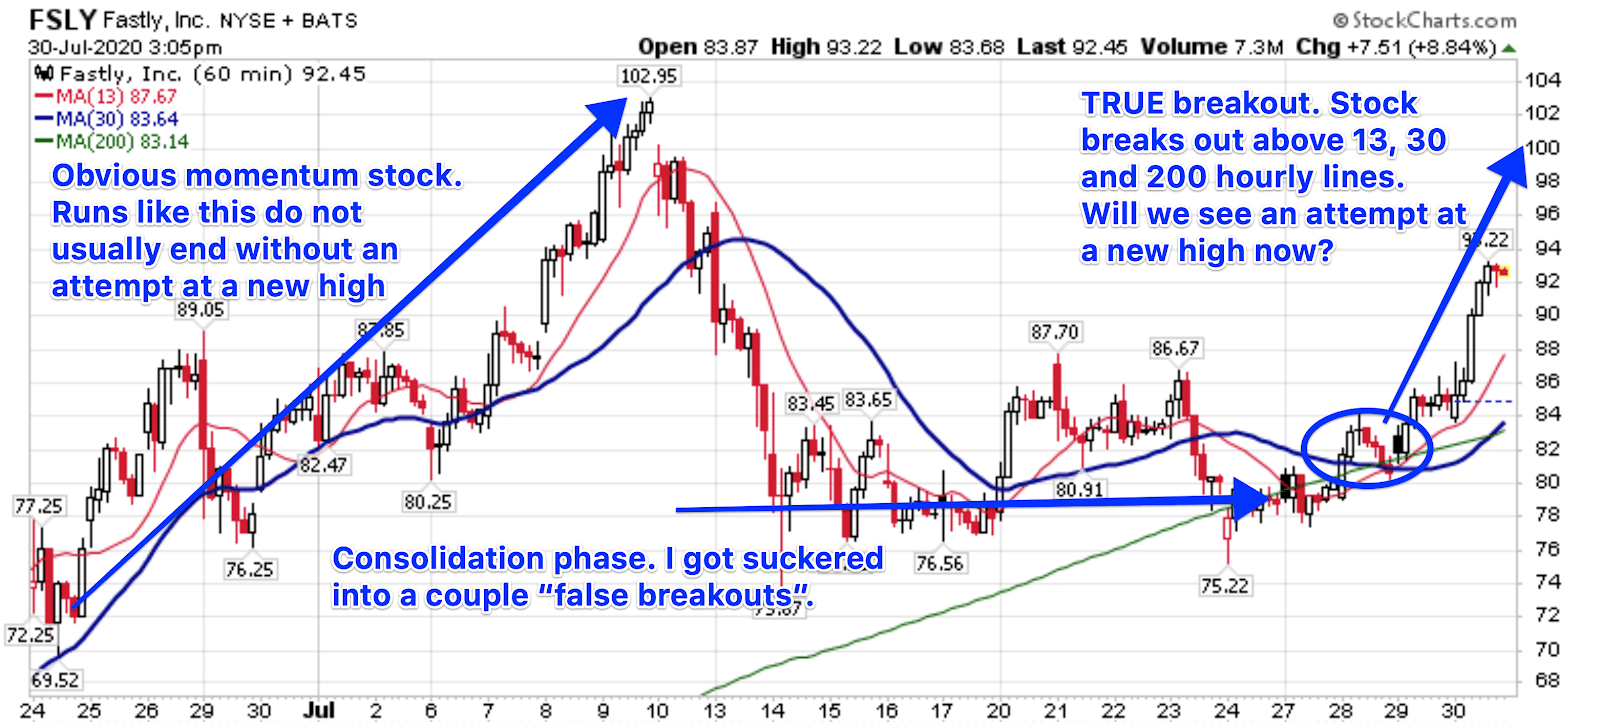
FSLY Hourly Chart
Let’s break it down from the first point – momentum.
I’d like to turn the clock back a little further so you can see the type of run this stock had.
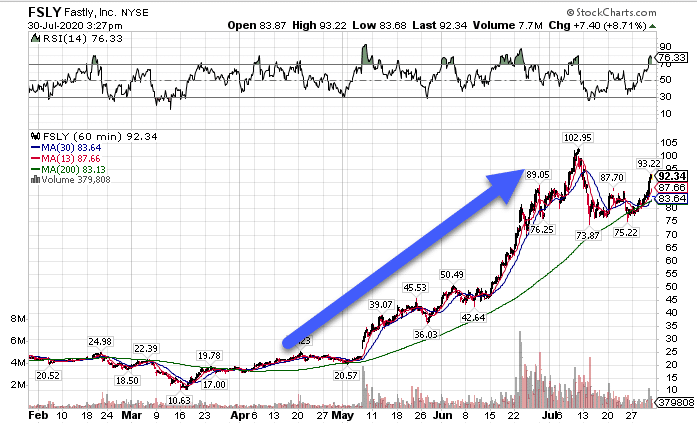
FSLY Hourly Chart
When you get penny stocks or small caps that suddenly catch fire, this is what they look like.
Notice how the volume was fairly tepid for the months preceding the breakout.
Then in May, volume spiked hard, pushing shares up into this amazing uptrend, one that lasted for another two months.
In fact, the stock kind of floated from $25 to $75 before we saw volume start to pick up. It was only then that shares finally started to create some sort of top.
Now, the contrarian would look at this and say – “It’s run up so much, it has to turn back.”
I’ll let you in on something. My years of experience tell me that markets don’t have to do a thing you expect.
Most of the time, they do exactly what you don’t see coming!
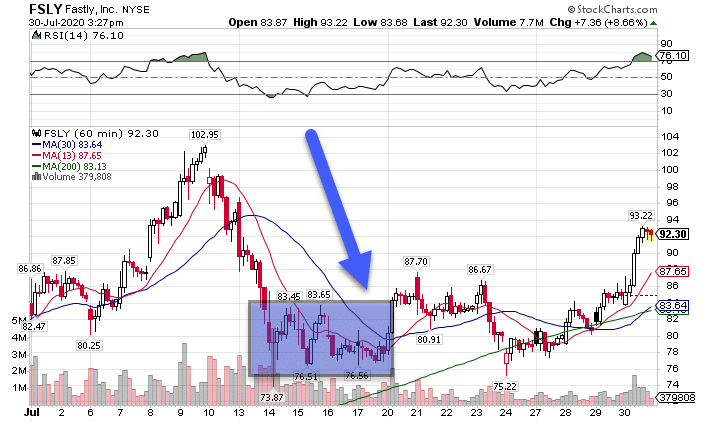
Eventually, the stock put in a top and pulled back into this consolidation pattern.
Here’s where the setup came in.
That consolidation happened at a level that I expected it would bounce from…and it did.
The problem was WHEN I entered the trade.
You see, I waited for the moving average crossover, which put me in the trade after the stock already made the move.
If I had bought call options during the consolidation, I would have been able to sneak out a profit. But, I didn’t have a signal.
Instead, I got sucked into the false breakout.
Round 2 – FIGHT!
Alright, so the stock beat me the first time.
Then I came back for seconds.
On the second round, I waited for another signal, one that would give me a better entry and shot at winning.
In walks the 200-period moving average.
Sometimes when price comes into the gravitational line, it bounces hard.
Other times, as it did in the case, it rode along it for a little while.
Now, this could have been another fakeout. However, I had a better entry.
With the gravitational line as support, I could enter into the trade when the stock was trading around $76-$82 rather than $82-$87.
It addition, I had a clear stop out level at the recent lows, where a daily close below $75.22 would put me out of the trade.
In this case, I put on two trades.
First, I bought outright call options going out a couple of weeks. Since this was the hourly chart, I expected the trade to either breakout or fail in about 5-10 days.
Second, I sold a put credit spread underneath the support levels. With the put credit spread, even if the stock didn’t take off running, as long as it stayed over those strikes, I’d make money by expiration.
As it turns out, the trading gods were on my side as the stock took off like a rocket even as the broader market struggled to gain traction.
Turning trades into profits
Now, the second trade could just as easily have failed. Even with a high probability trade, they still lose.
But, I’d take that trade every time as my experience has shown me that those setups, when managed properly, work out in my favor often enough to make a sweet profit.
Now, I know it can be tough to learn how to identify these types of trades.
That’s why I created my High Octane Options.
In High Octane Options, not only do you get to see my trading feed in real-time…
But a proprietary scanner pulls out my money-pattern crossover from thousands of stocks – cutting through the clutter to zero in on potential juicy setups.
