We’re living through a market straight out of Lewis Caroll’s Alice in Wonderland.
Traditional correlations between stocks and safe-haven plays have all but disintegrated.
So, it’s no surprise gold tore through the 2011 high without much fanfare…
And just a little further to go in the GLD ETF.
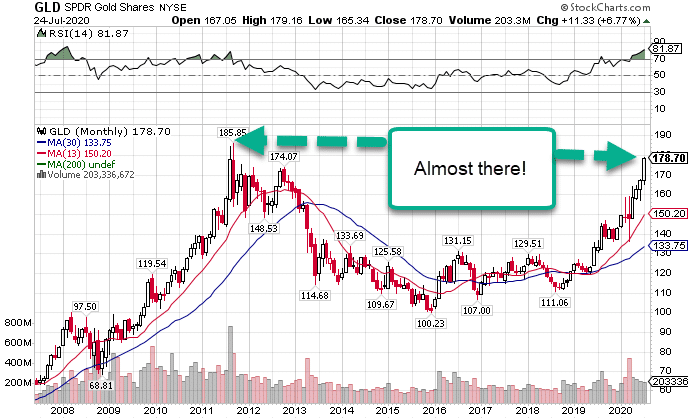
GLD Monthly Chart
Seeing this line up with a crashing dollar sends a very clear signal.
Stocks won’t hold on much longer!
We’re already seeing cracks in the armor form.
The big guns, Apple, Amazon, and Tesla teetered on the brink last week.
With the Fed announcement on the way and earnings, markets are setting up for a gnarly pullback.
I plan to get in and out of some bullish bets in my High Octane Options Portfolio before Wednesday.
That’s when things really start to get interesting.
Because stocks take the stairs up, but the elevator down.
And there are a few sectors that look ripe for the trading.
What about gold?
Ok, so let’s talk about what’s on everyone’s mind.
With the GLD nearing the 2011 high and the U.S. dollar an important swing low, it’s like having the stars align.
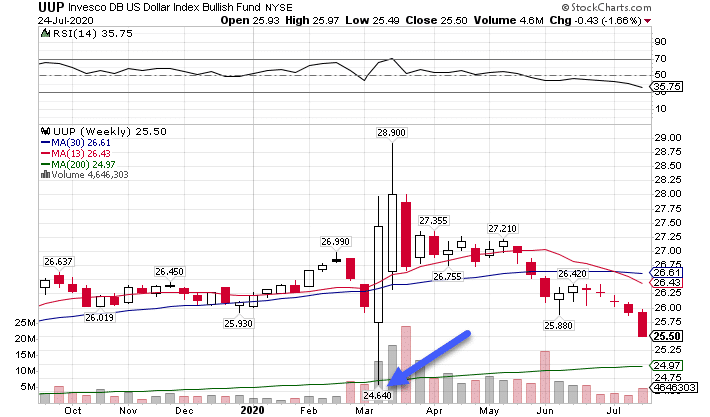
UUP Weekly Chart
We’re seeing the dollar approach the sweeping low it made in March as well as the 200-week moving average.
When you combine that with a Fed announcement on Wednesday, I bet dollars to donuts that it acts as a turning point for both of these.
The dollar is overextended to the downside and gold to the upside. Both need to either reverse completely or at least take a breather.
Tech Wreck
Why is it that the Nasdaq 100 outperformed the S&P 500 and the Russell 2000?
I’ll tell you.
It’s because of the heavy weight of a few stocks.
Pull these out of the mix and the sector begins to sour.
Compare the charts of Apple (AAPL) and the Nasdaq 100 (QQQ).
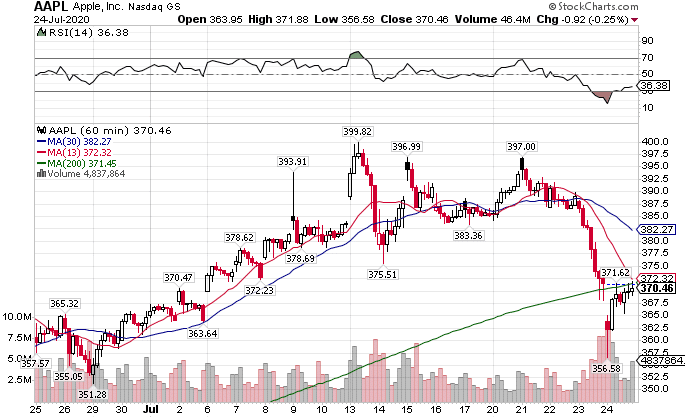
AAPL Hourly Chart
Apple looks pretty horrific. The massive drop was enough to drag down the entire index.
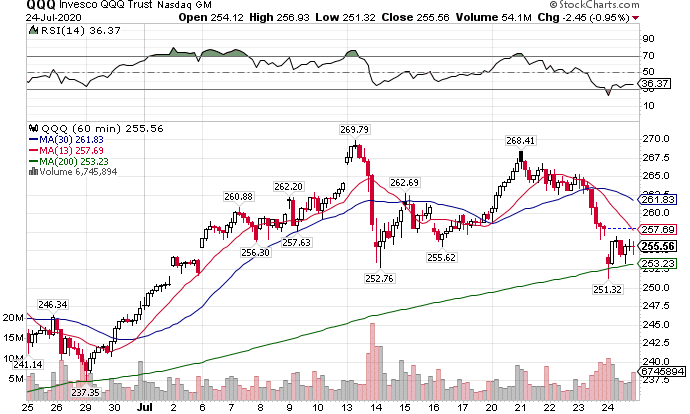
QQQ Hourly Chart
Curiously, both landed right around the 200-period moving average, something I teach extensively and you can learn from my Total Alpha Bootcamp.
Not all of technology fell apart. Semiconductors (SMH) managed to hold up reasonably well given Intel’s (INTC) poor performance.
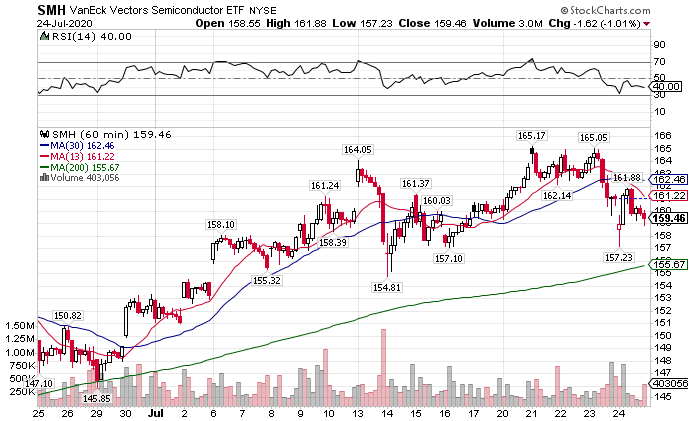
SMH Hourly Chart
Yet, you can see that it’s chart doesn’t look pleasant, plus it’s made a bearish crossover that showed up in the High Octane Options Scanner.
That’s why I’m expecting the sector to retrace higher into the Fed announcement. After it fakes enough bulls to buy into the story, most of technology should faceplant and take the rest of the market with it.
Energy’s on the move
Being beaten down off a crash in crude, severe production cuts left many smaller zombie companies broke. Larger integrated names can use their warchests to gobble up these assets at rock-bottom prices.
Once oil price rebound (which I expect before the end of the year), they’ll receive outsized benefits to the other players.
Already, these names looked quite healthy to end last week.
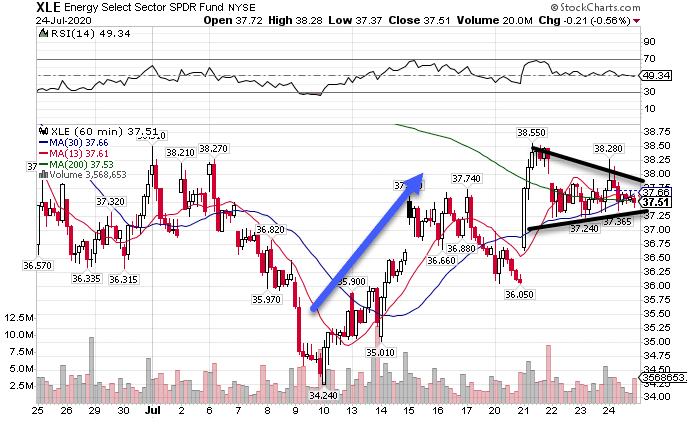
XLE Hourly Chart
This chart setup looks fantastic for another push higher. Energy companies pushed off the lows on the 10th, making a short pullback, before shooting up early last week.
Now, pieces began making a consolidation pattern, highlighted by the black trendlines that connect the tops and bottoms of the candlesticks.
As they converge, shares should move out and upward along the same trend.
Additionally, we see the 200-period moving average coming into play.
Plus, a falling dollar means higher crude prices (since they’re denominated in dollars) which benefits these players.
Bond breakout
Bonds also signal the short-term demise of equities.
What’s cool is seeing how a classic bullish consolidation pattern played out here.
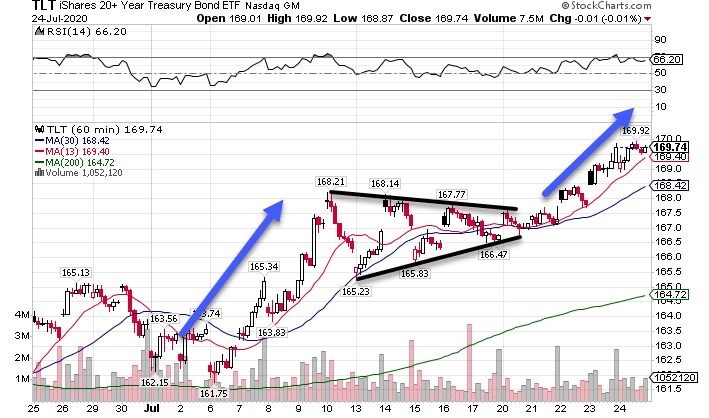
TLT Hourly Chart
Check out how the TLT ETF ripped higher in early July, made a clear consolidation pattern where the trendlines highlighted a contracting price channel, and then took off again.
On the top of the chart, I want to bring your attention to the Relative Strength Index (RSI). Notice how the consolidation period took some air out of the RSI, keeping the next move higher from entering severely overbought territory.
Considering these together, I expect bond prices to continue to their ride higher even after the Fed announcement.
Directional trades at their finest
A lot of people find this market difficult to trade. All the rotations between sectors can be tough to track.
That’s why I created High Octane Options.
I wanted to deliver traders my best ideas and plans for trading them.
It’s not just about streaming my trades so you can see what I’m doing in real-time…
It’s about learning why and how I play them.
