In my brand new service, High Octane Options , subscribers get access to a proprietary scanner which helps me filter out the noise and find high-quality setups.
Some bearish, some bullish.
Throughout the day you might see dozens of trade ideas pop up in real-time.
But, is every setup worth trading?
No, and later on I’ll explain in greater detail on why that is.
But before I do, I want to tell you what else you’ll discover.
And that’s how we turn trade ideas into actionable trading plans.
As well as, how to find what I believe are high-probability setups.
VMware Inc (VMW)
This chart popped up on the scanner back on Friday. The setup here is a little funky, so I think it’s worth going over.
Let’s start with the hourly chart.
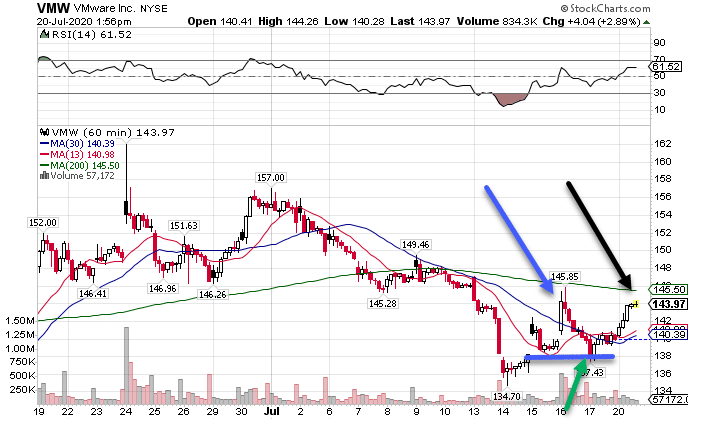
VMW Hourly Chart
If you didn’t know, the High Octane Options scanner sifts through stocks looking for my money-pattern.
For the last few weeks, VMW hadn’t shown a whole lot of promise. Price collapsed through the $146-$147 support area, bottoming out around $135.
Once it came off the bottom, shares rallied, jumping back over both the 13 and 30-period moving averages. It landed just shy of the 200-period moving average, one of the most critical for my trading.
Here’s what really caught my eye.
Look at where the green arrow is pointing. Right there, price came back into a gap-fill (marked by the blue trendline) and bounced back above the moving averages (red and blue lines).
When I see a stock bid up at key support levels, that indicates interested buyers.
I love this setup because it makes the trade black and white.
Going long, I can place my stop below the recent lows and set a target of the 200-period moving average or slightly above.
With an entry right around $140, that gives me about a $5-$6 in upside potential and about the same in risk to the downside.
Knowing that, as long as I win more than 50% of these kinds of trades in general, I should make money over time.
Twillio (TWLO)
Here is another fantastic setup that the scanner identified. What I love about this is it gives us multiple views of crossover.
Let’s go to the charts.
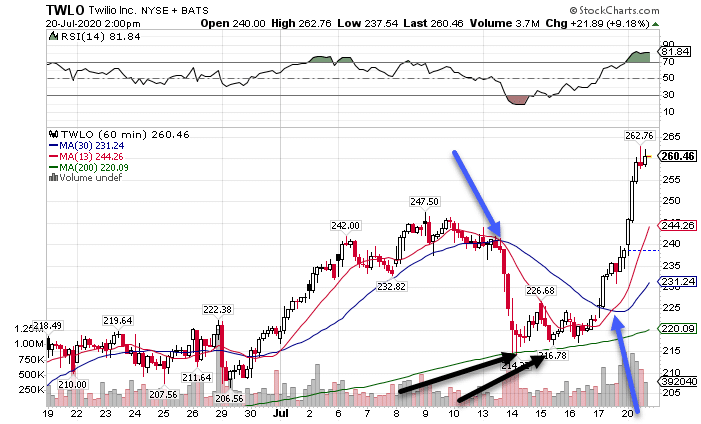
TWLO Hourly Chart
First, take a look at the left-most blue arrow, which points to a bearish crossover. At this juncture, TWLO rose from $210 to nearly $250 on bullish momentum.
It wasn’t until price started trading sideways and then keeled over that the crossover identified the shift in sentiment.
Now, take a look at the black arrows. Again, we see how the 200-period moving average acted as support, allowing the moving averages to catch up with the steep drop in price.
Afterward, as shares started their ascent, the moving averages signaled another momentum shift yet again.
This time, it led to an explosive move from around $225 all the way up to $265.
Unlike the setup in VMW, this one presents a trickier trade.
We got no pullback after the crossover, other than a whisper late on Friday. After that, it was off to the races.
Additionally, there wasn’t a natural target other than breaking the old highs around $247.
For me, I’d take this trade slow.
Instead of grabbing a full position, I would start with a smaller entry. If price pulled back, I could always add at lower levels.
That allows me to manage my risk without giving up on the trade entirely.
As before, I could use the lows as a stop for the trade.
Delta Airlines (DAL)
Now I know what you’re thinking – of course, Delta didn’t work out, the stock has been awful!
You are absolutely right.
And that’s the exact reason I brought up this trade.
Context is just as critical as the setup itself for a successful trade.
Here’s what I mean.
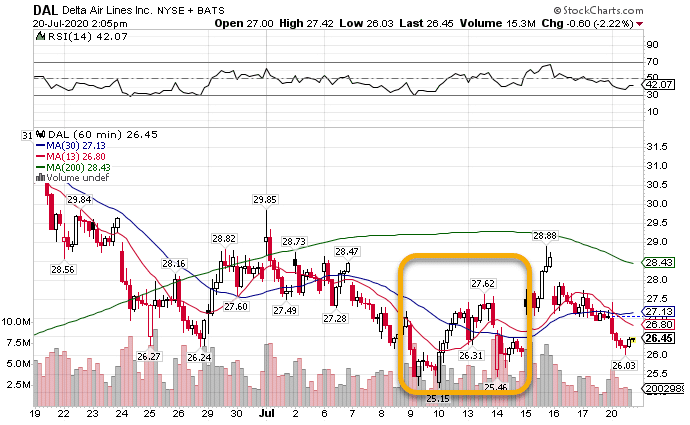
DAL Hourly Chart
Similar to the other charts, we had a bullish crossover.
So far so good.
Shares then pulled back into the moving averages.
But, instead of bouncing, they dropped below them.
True, they popped back up several days later, but it never reached the 200-period moving average which would have been a natural target.
If I tried to buy options here, I would have had a tough time turning a profit. While we got a rally, it wasn’t much of one, and it came many days later.
By that point, time decay would have eaten away at my premium, making the options worth less.
This setup highlights how much context matters.
Technology stocks may be in vogue. But no one wants to send any love to the airlines.
Don’t fight the trend
Unless you’re a countertrend trader, going with the larger trend is much easier than against it.
That’s why I color code the setups for High Octane members so they know whether they’re looking at a bullish or bearish setup.
On top of that, I explain how and why I get into the trades I do enter because, as we discussed, not all are created equal.
Lucky for you, I have spots left in my upcoming webinar for High Octane options.
Here you’ll learn more about what the service offers including the proprietary scanner.
Click here to learn more about the High Octane Options Webinar.
