Take a look at the chart below:
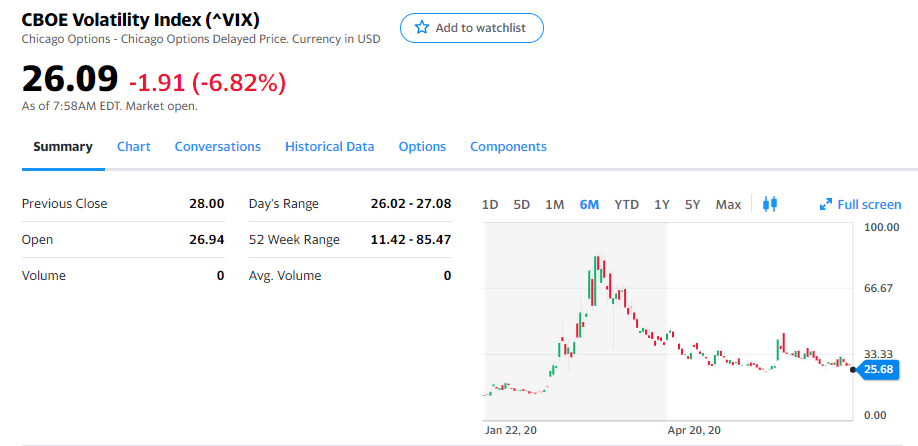
It’s of the VIX, the market’s barometer for fear and greed in the market.
During the height of the pandemic and market sell-off it soared above 85…
…but since then it has come off substantially.
You see, when the VIX declines it shows me that traders are comfortable with the current state of the market…
The less fear they have… the more likely they’ll continue buying up stocks.
And because of that…I’ve started to do so myself.
![]()
With one of my best trades coming in High Octane Options with Draftkings*
*Please see disclaimer below
So, which stocks and what sectors are set to lead this next run?
Rotation into retail
Nevermind that states are curtailing their plans to reopen. Investors decided to show these stocks love for the first time in months.
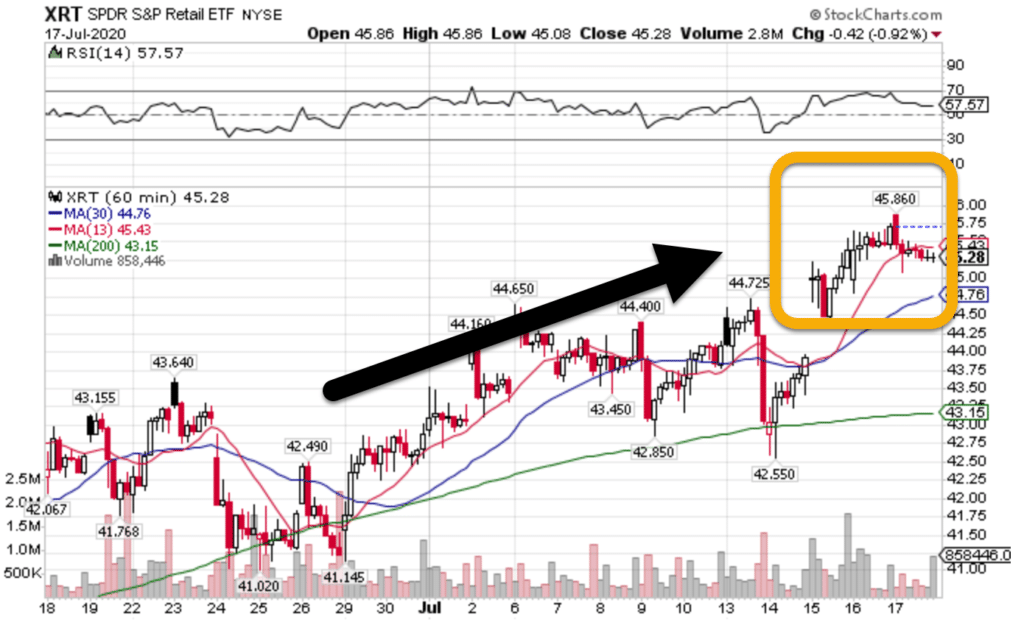
XRT Hourly Chart
You can see how these unloved stocks found interest last week. And, as I teach High Octane Option members, the hourly chart already started to make a bullish pattern.
And it’s not just the retail stocks. Many of the restaurant names started showing life at the end of last week.
I’m talking about names like Cheesecake Factory (CAKE), Dave and Busters (PLAY), and others.
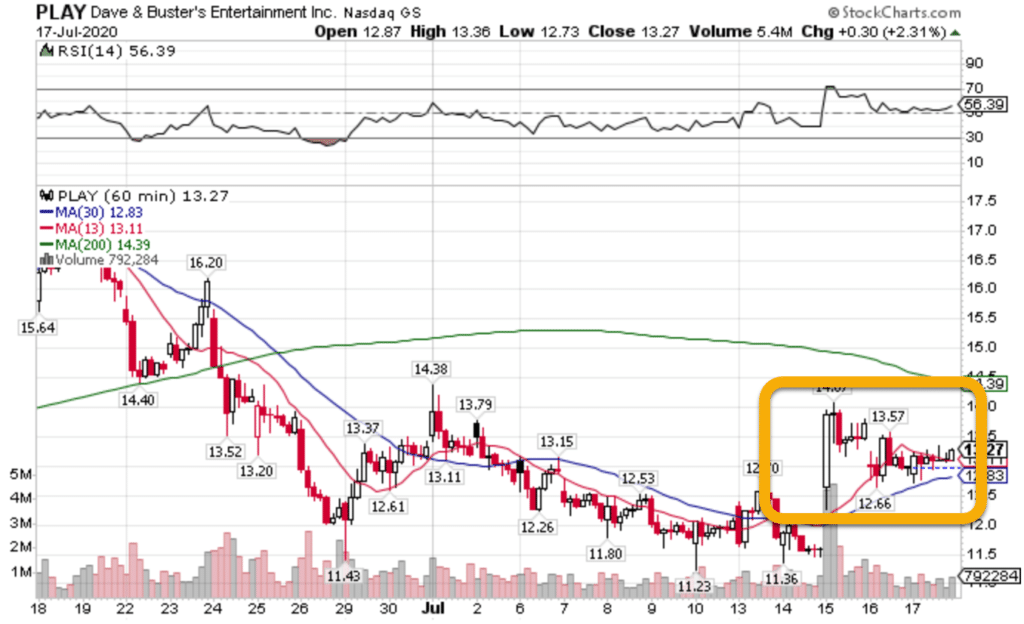
PLAY Hourly Chart
In this hourly chart, you can see how Dave & Busters clearly springboard off the bottom, marking a stunning reversal.
And if you know anything about chart patterns, you understand why this looks ripe to push higher.
When winners become losers
Recent price action hasn’t been kind to all the companies out there.
Investors slapped shares of Netflix (NFLX) down on earnings only because of poor forecasted subscriber growth.
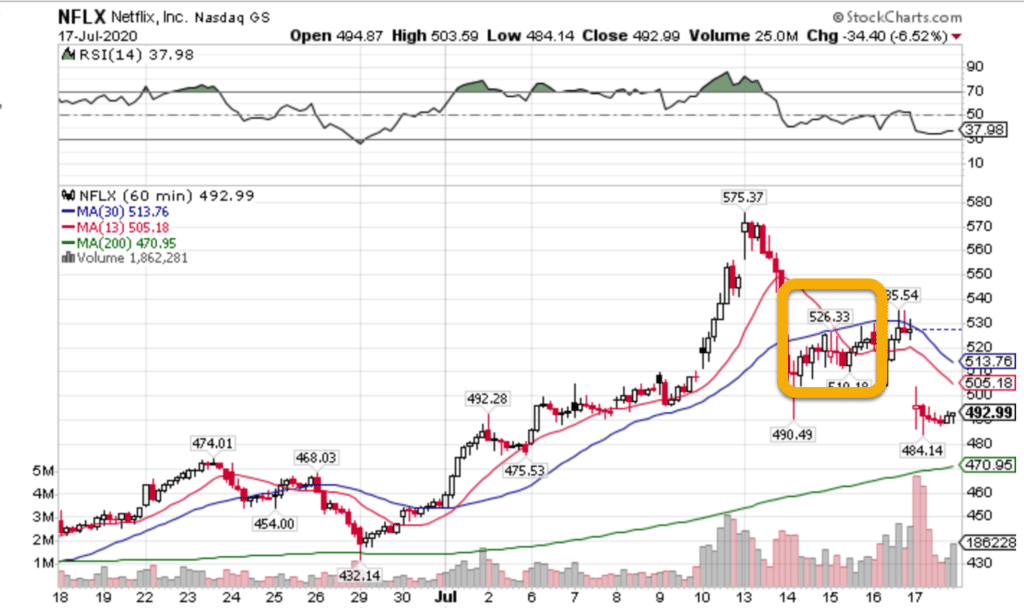
NFLX Hourly Chart
What’s really interesting is how the moving average crossover preceded the decline.
And it was caught on the high-octane option scanner.
But Netflix wasn’t the only one to get smoked. Tesla might have finally found a top.
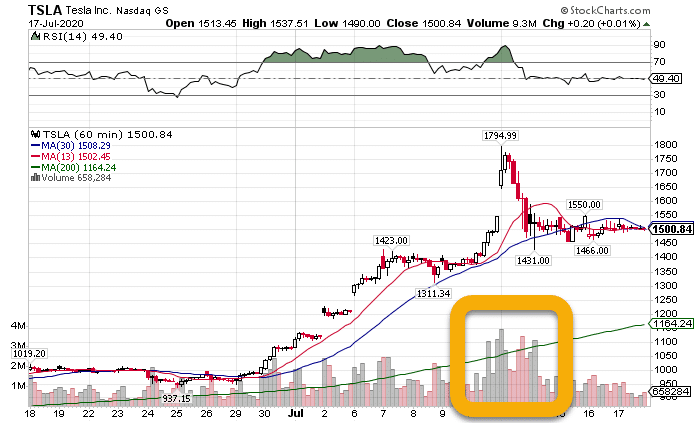
TSLA Hourly Chart
On pretty significant volume, the one-time wonder attracted the interest of numerous Robin Hood traders, leading to a temporary reversal in shares.
Even the almighty Amazon bowed to the selling pressure.
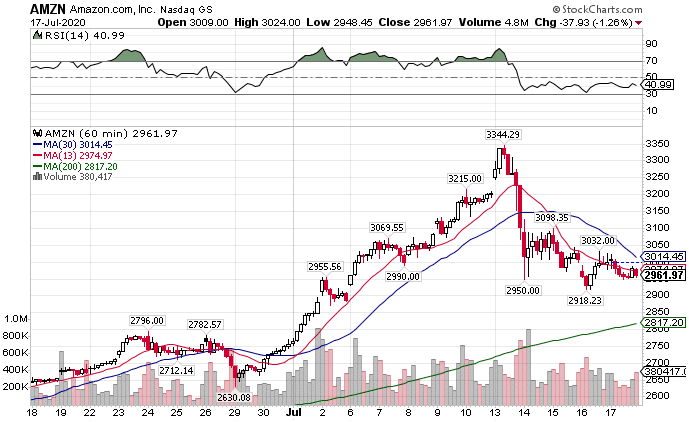
AMZN Hourly Chart
To be fair, I don’t put Amazon in the same category as the other two. It’s carved out a niche all on its own and becomes a surrogate for US economic activity.
And not all of technology has a bearish tinge to it.
Semiconductors don’t look nearly gnarly, but they could put on a better game face.
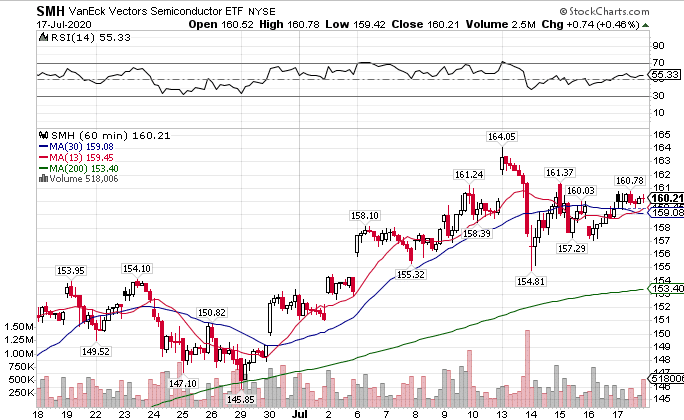
SMH Hourly Chart
Financials could be red-hot
One area that’s really starting to pop off are the financial stocks.
While earnings aren’t particularly useful, a lot of the big banks managed to score large revenue windfalls from market volatility.
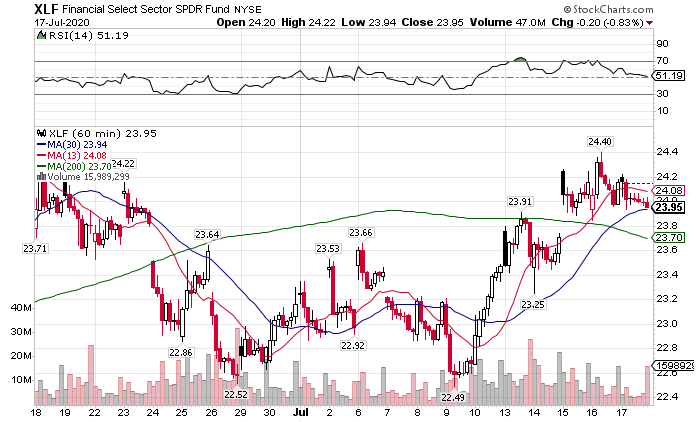
XLF Hourly Chart
Even with net interest income driven down by expensive bond prices, financials jumped almost 10% in a matter of weeks.
However, the joy isn’t being spread around evenly. Regional banks are getting left behind their larger brethren.
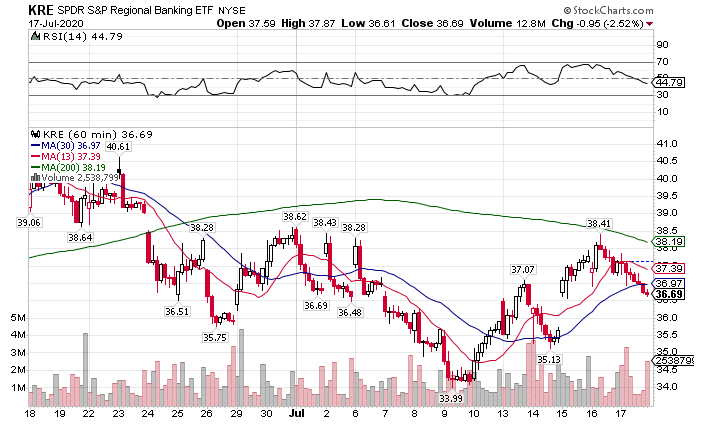
KRE Hourly Chart
Comparing the two charts, what’s the first thing that jumps out at you?
To me, my eyes immediately go to the 200-period moving average. The XLF managed to get and continue trading above the indicator, while the KRE fell away before getting there.
This sector is on fire
Now, there is one sector that continues to go full-throttle despite the pandemic…or maybe because of it.
I’m talking about biotechs.
Looking at the XBI ETF, I can’t think anything other than higher and higher.
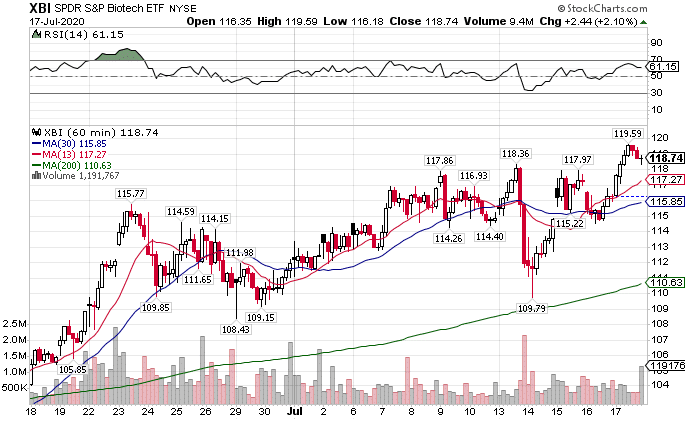
XBI Hourly Chart
What’s really neat is how the ETF got really close to the 200-period moving average (green line) and bounced off with some serious force.
That’s a clear sign of buyer participation.
Plus, as we get closer to a vaccine and treatments in the coming months, there’s likely to be a couple of stocks within the sector that really get bid up on news.
How to get started
Now, there’s a lot of choices out there when you look at potential trades.
That’s why I created my High Octane Options.
Focused on directional options, this service gives you my live portfolio as well as how I strategize and execute trades.
It’s a great place to follow along with a seasoned professional and learn how I approach the markets every day.
