I’ve got a great lesson for you.
Last week I managed to pull in $150,000 in profits trading Tesla intraday.
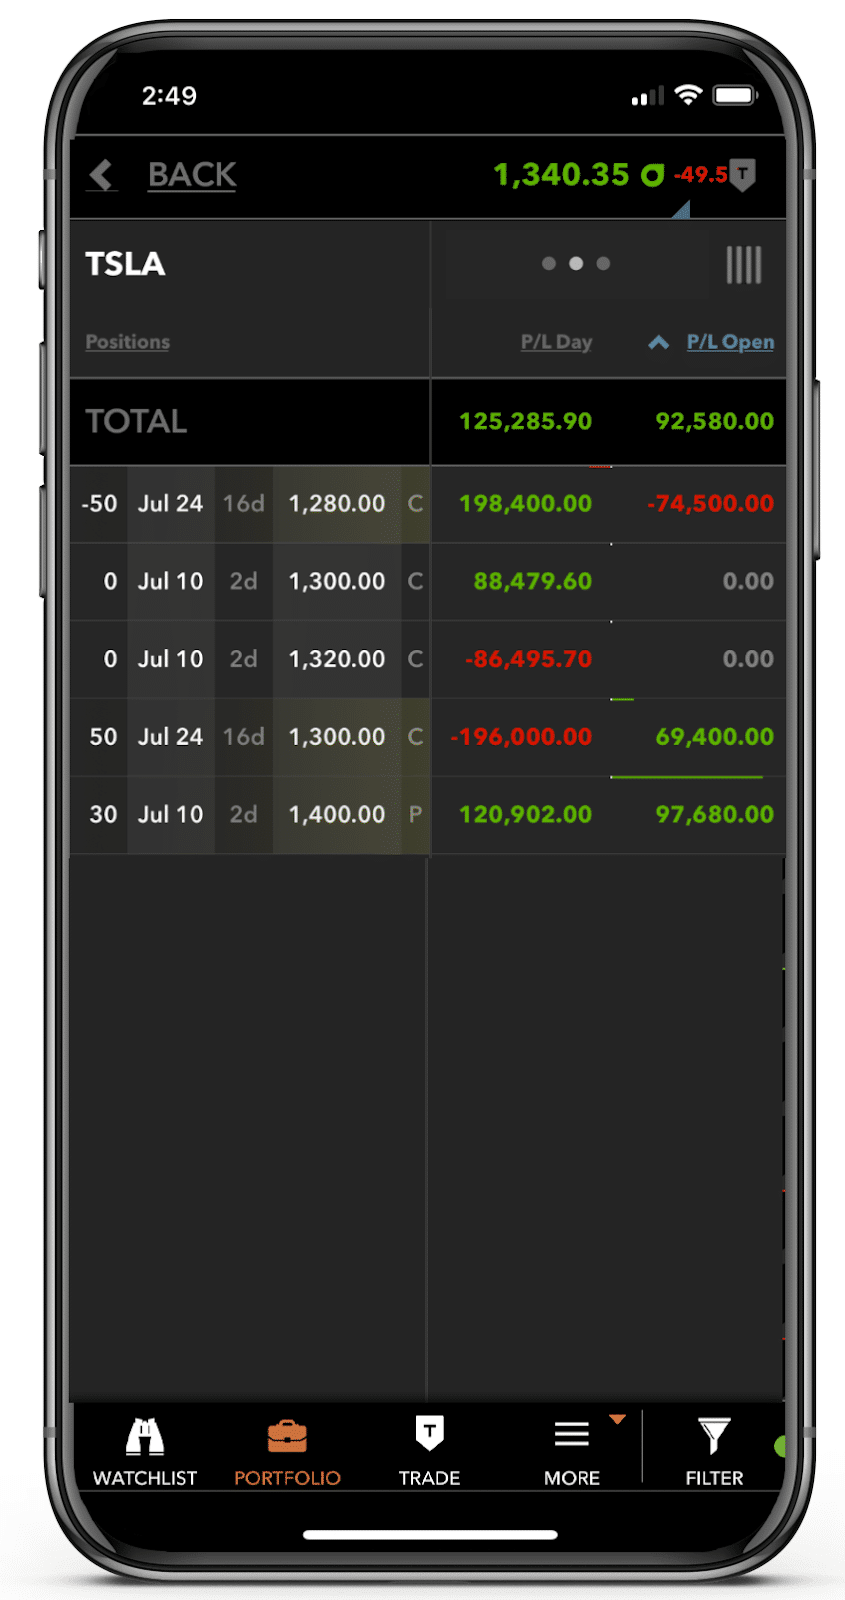
Total Alpha members got to watch me trade this in real-time!
*Please see disclaimer below
It ranks as one of my top trades of all-time.
That alone makes it worth dissecting and examining.
That’s why I’ve created a short video for you to check out.

Click here to watch my video lesson.
In addition, I take the discussion even deeper.
The big picture
First, let’s start with the context. Tesla shares soared from $950 to $1400. In percentage terms, that’s roughly what it did when it went from $600-$900 and blew everyone’s mind earlier this year.
A parabolic move like this always has me looking for a top. The only thing I didn’t see here was the type of volume we got back on that initial move.
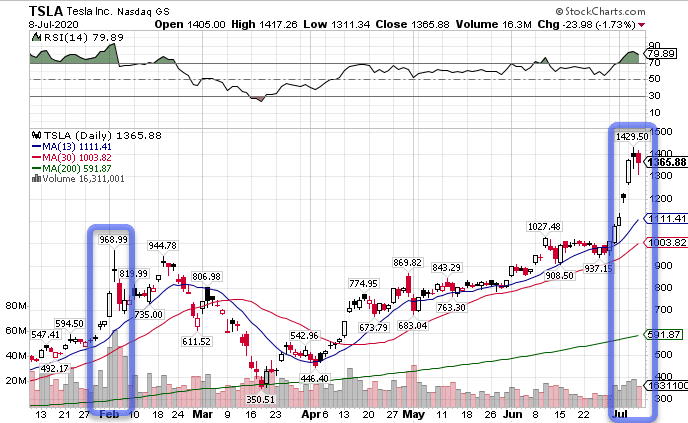
TSLA Daily Chart
Notice how much heavier the volume was the first time. That’s a sign of a multi-day reversal. When I see these at highs and lows, it’s a sign of exhaustion volume or a flush of buyers/sellers.
Nonetheless, the RSI (top of the charts) was already way overbought. So, I was looking for a pause somewhere along the way. The
The shorter timeframe
Now, let’s make our way to my favorite hourly chart.
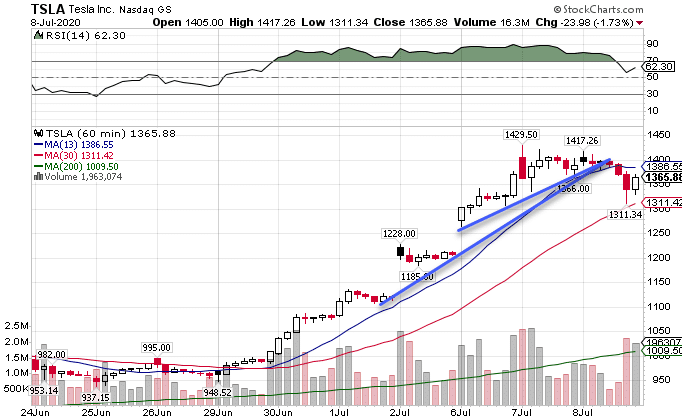
TSLA Hourly Chart
I drew two different trendlines here because let’s face it…trendlines can be subjective.
BUT…when they land in the same area, that gives me something to work with.
You see, both of them created a shelf or point of reference. Once the stock started to crack and then drop below the 13-period moving average for the first time in a long while, I expected selling pressure to pick up.
What’s great about this trade is I’m so close to risk (AKA my stop out), that the risk/reward is fantastic.
Using the highs as my stop, I want to get more than the distance between my entry and the top as a potential reward.
Keep in mind, this stock could have crashed hundreds of dollars in a day under some real pressure. At that point, I would have bought myself a second flamethrower!
Now, the question became whether I buy put options expiring this week or the following week. Both were extremely expensive.
But, I went in-the-money to cut down on the extrinsic value and went with this week’s expiration.
That meant I needed to be out of the trade same day.
If I had gone with the options for the following week, I don’t know that I would have been able to go as far in-the-money because they were so expensive.
That tradeoff made me look towards the options expiring this week.
Selecting targets
Picking out profit targets is part art and part science. I know I need to balance the win-rate for the trade with the risk/reward in order to generate positive expected value.
You can read about expected value in my previous editorial.
Oftentimes, I’ll look for areas of support or resistance for my targets. This can use any of the following:
- Moving averages such as the 13, 30, and 200 period
- Recent consolidation levels
- Fibonacci retracements
While this list isn’t all-inclusive, it gives the most common ways I look for support levels.
From there, I want to scale out of the trade. That means as the stock hits a target I take a portion of the trade off to lock in the profits.
Then, I let the remainder run to another target with a stop back at breakeven on the remaining amount.
That way I lock in profits and make sure I walk away a winner.
Scaling out also allows me to hedge my bets so to speak. Rather than trying to get the exact low or high for my target, I accept I’m not that good and try to just average my way out.
Learn even more of my techniques
You can catch my Total Alpha Options Masterclass today. Learn some of my favorite ways to analyze and trade the market right now.
Click here to register for my Total Alpha Options Masterclass.
