The Nasdaq is at all-time highs…
The S&P 500 and Dow aren’t too far behind.
Is the start of another leg higher for stocks…
Or a prime opportunity to start shorting?
I’ve put together 7 charts which help build my case.
Which direction am I leaning on?
Small caps cry for attention
Over the last half-century, most sustainable rallies are led by small caps. More sensitive to the economy, these companies grow quickly during booms and fall apart in busts.
When I see large-cap companies doing so much better than the Russell 2000 index, it raises a red flag.
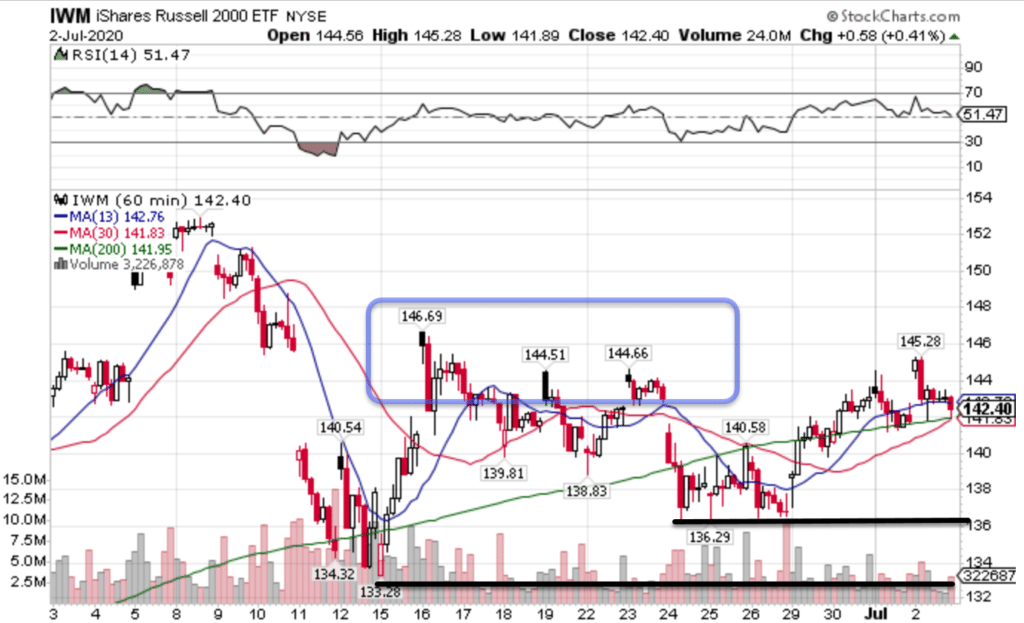
IWM Hourly Chart
In the chart, I highlighted three areas of focus.
First, there’s a series of lower highs that not only weren’t sustainable but like the SPY, acted as resistance on Friday.
Second, the IWM continues to ride the 200-period moving average. First above it, then below it, then back above it. While gravitational lines often hold significance, the more it trades around it, the less important it becomes.
You can learn more about gravitational lines in my Total Alpha Options Masterclass here.
Naturally, I want to know where things get more bearish and bullish. That’s the easy part.
Bulls need to recapture the recent highs and close above that area, around $147. Otherwise, the black trendlines marked on the chart are the next stops for the bears.
Each time they take out one, watch to see whether they bounce or just sit on top of it. If bulls have any strength, they should be able to create some rally.
VIX fills the gap
One interesting chart that most traders missed last week was the VIX. While everyone was focused on watching it fall, I saw something important.
Take a look at the chart below.
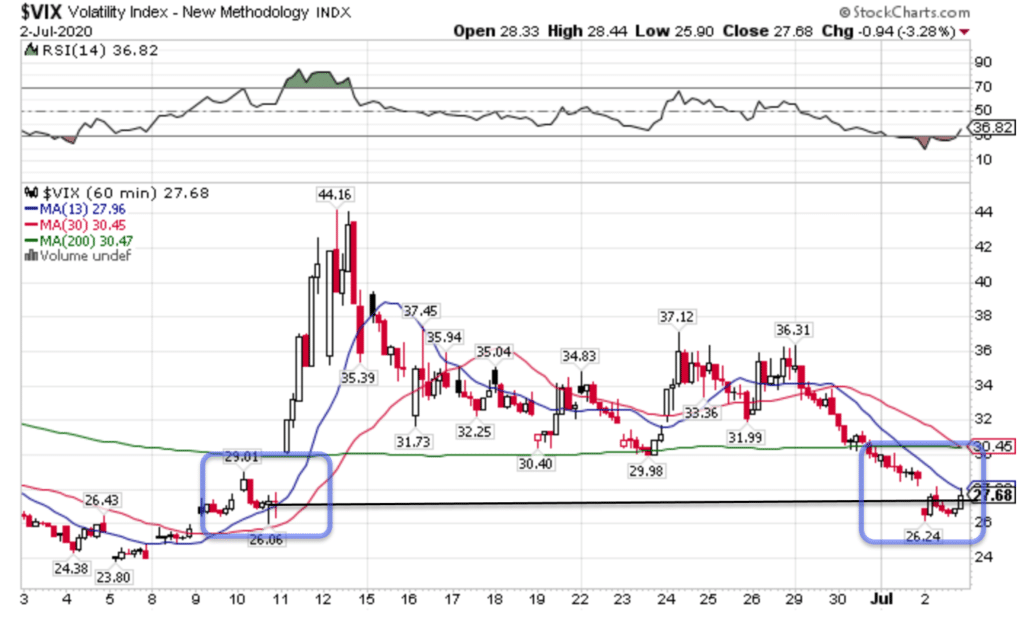
VIX Hourly Chart
Not only did the VIX fill the gap, but it bounced back, closing near the highs of the day.
Since the VIX and equities often trade in opposite directions, I read this as a warning sign.
If we start seeing implied volatility increase in the coming weeks, I plan change up my High Octane Options trades from calls to more puts.
Weakness underneath tech
Pundits would have us believe that all we need to do is ride the tech train. With the QQQ at all-time highs they certainly have a point.
I mean, look at this crisp price channel.
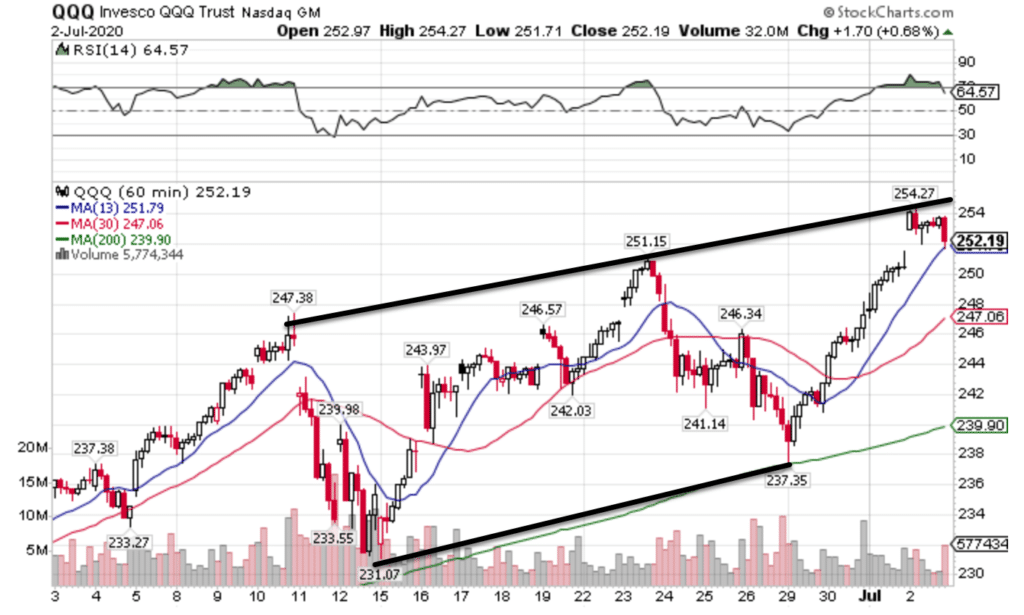
QQQ Hourly Chart
Sometimes I still marvel at how well trendlines work, not to mention the 200-period moving average.
Dig a little deeper, and we find that tech’s veneer give way to an underlying weakness.
To illustrate this point, let’s look at semiconductors, a common leading indicator.
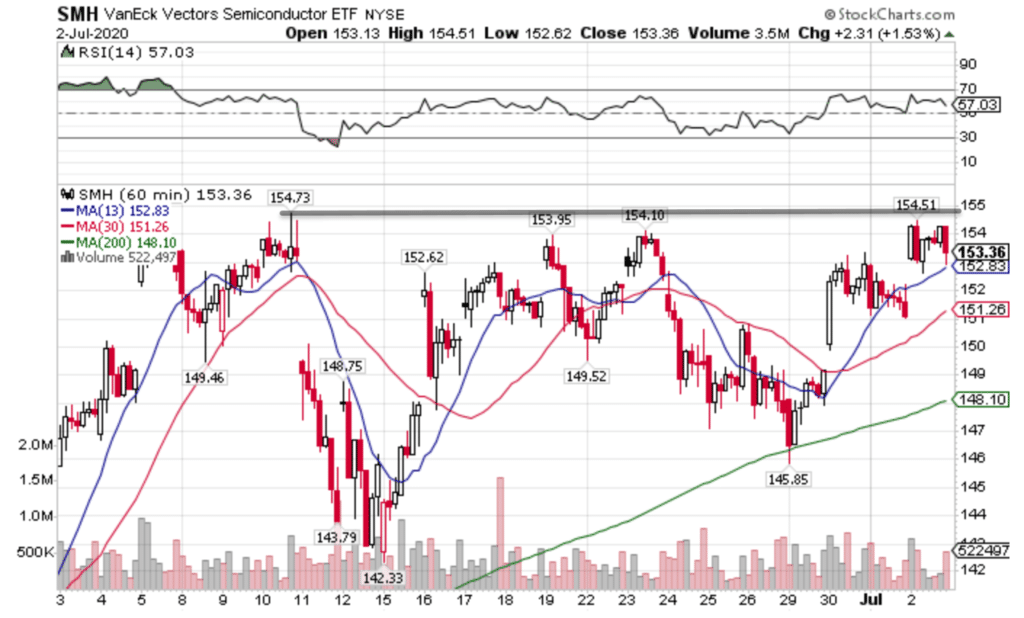
SMH Hourly Chart
Notably weaker than the rest of tech, semiconductors aren’t making new all-time highs. In fact, they’re just consolidating under a resistance level.
Normally, I would take this as bullish behavior.
But then I look at a chart like Apple here and I start to wonder…
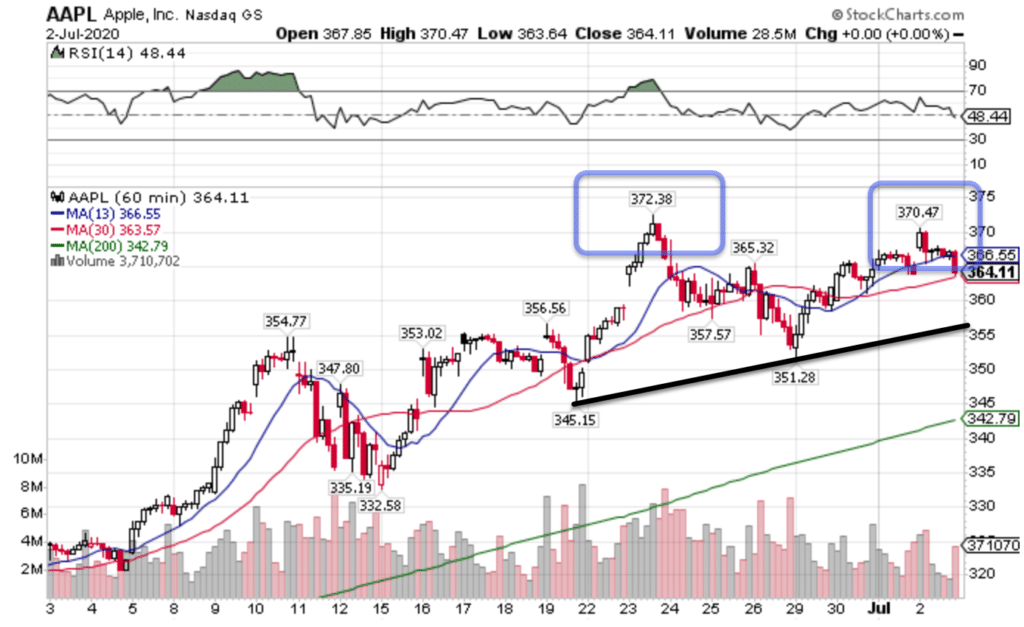
AAPL Hourly Chart
If tech’s rally is as strong as we’re led to believe, why did Apple make a lower high?
While it hasn’t fallen apart yet, a break of the shelf marked by the black trendline would bring out the bears in Apple. Given its prominence in the Nasdaq 100 and the S&P 500, that could spell trouble.
Bond buoyancy
Let’s not ignore the fact that bond prices continue to hold in the face of the stock rallies. That’s extremely atypical.
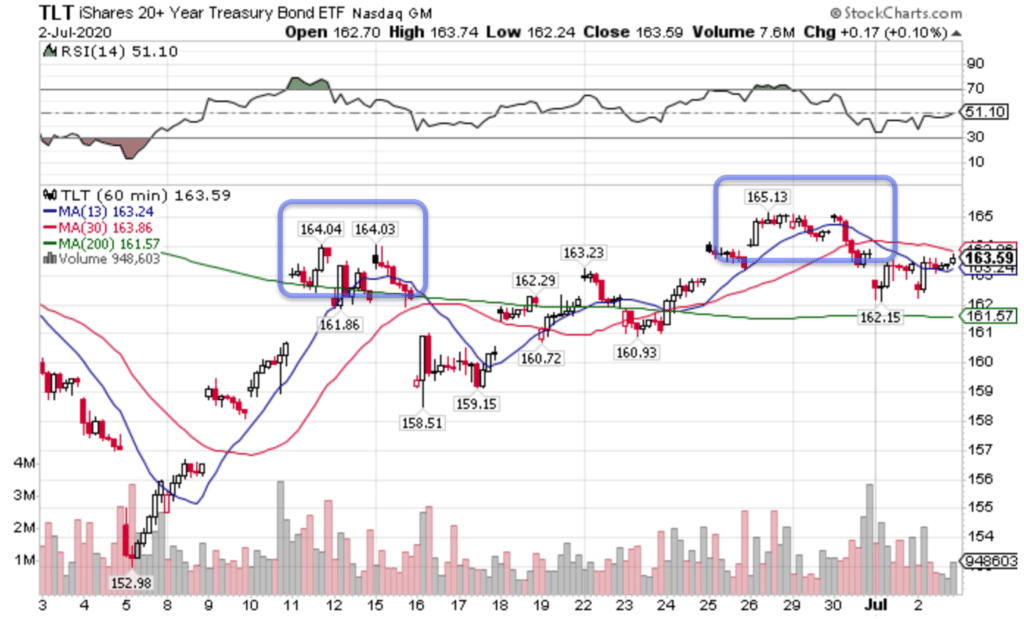
TLT Hourly Chart
Unlike some stock indexes, bonds made a series of higher highs and continue to consolidate near their highs. If they’re so bullish on bonds, what does that mean for equities?
Playing the SPY
So now the $1000 question – how will I trade the SPY?
In the chart below, I marked the guideposts for the bulls and bears.
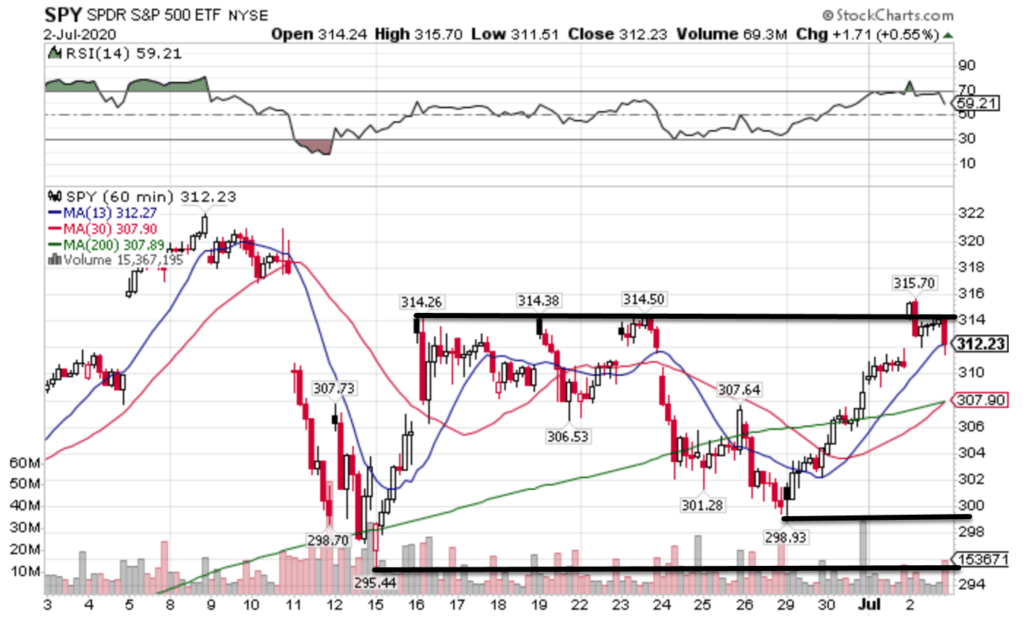
SPY Hourly Chart
Bulls need to close above the $315 level, pure and simple. Do that, and we’ll see a vacuum to the upside.
Close below $300, and I don’t think the $295 low will hold for very long.
A lot of these decisions I make in real-time.
If you want to not just see when I make these trades, but how and why, then I suggest you check out High Octane Options.
