Equities face an uphill battle with reopenings slowing down and Coronavirus cases rising.
The Fed’s already jumped the shark, buying debt from Berkshire to AT&T.
Like a used orange, there isn’t much juice left to squeeze from stocks.
But I have a few ideas where to find some…
And one of them happens to be a target for my High Octane Options.
I’m talking about the yellow metal coveted by King Midas – Gold.
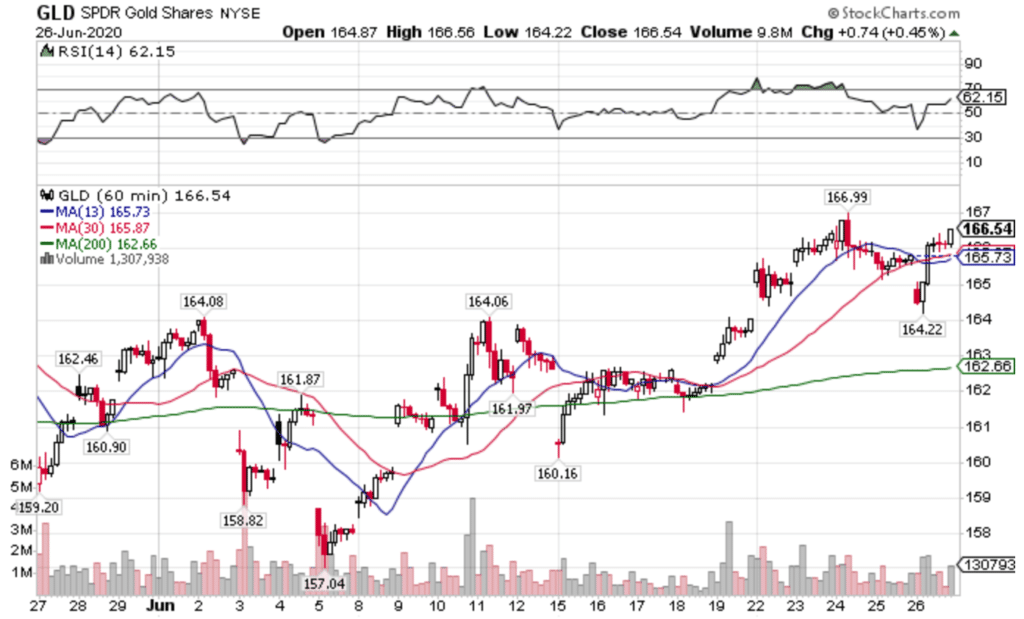
GLD hourly Chart
Yes, 9 out of 10 people prefer gold to pickled herring.
Although, that’s not what’s behind its recent move.
So why is this sector climbing while stocks are having a meltdown?
Let me explain.
What the run in gold means
Investors around the world love to hide their money in gold during times of uncertainty. This store of value has been used throughout history for thousands of years.
Yet, with equities near their peaks alongside gold what does this tell us?
To that, we need to look at the U.S. dollar.
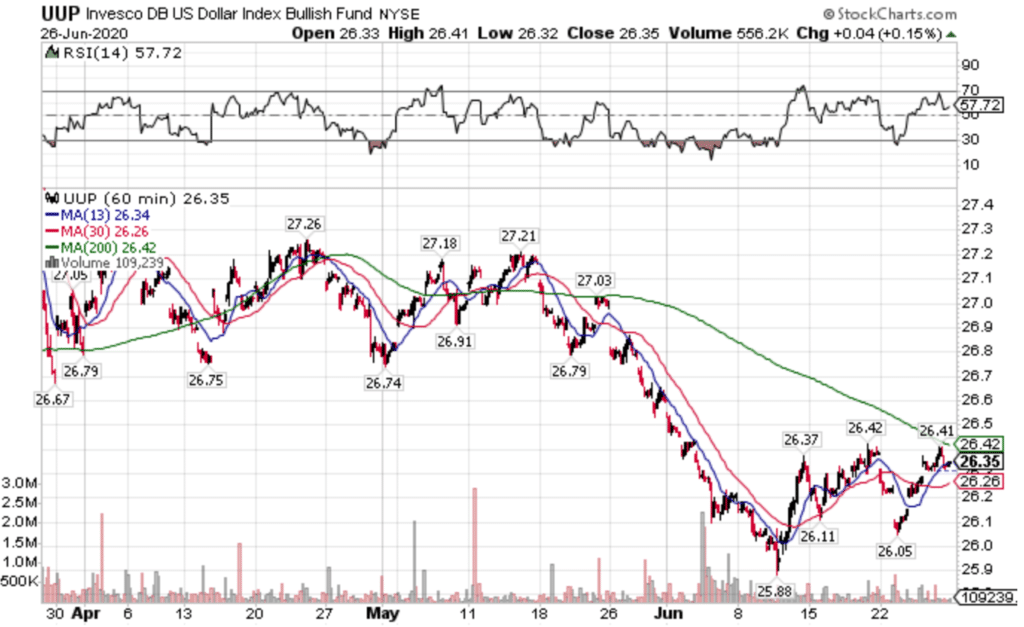
UUP Hourly Chart
Over the last couple of months, the dollar fell off its highs as stocks rose. To be fair, equities bounced before the end of March while the dollar only started its slide in late May.
And, in the bigger picture, the dollar isn’t down all that much.
So, has the Fed achieved their desired inflation?
Here’s what I think is really going on.
The race to the bottom in currency devaluation took everything down at once. Relative to other countries, the U.S. dollar didn’t fall as far.
That’s why it holds near multi-year highs while gold continues to higher.
In fact, I expect that all hard assets from gold to oil will continue to gain value in the coming months.
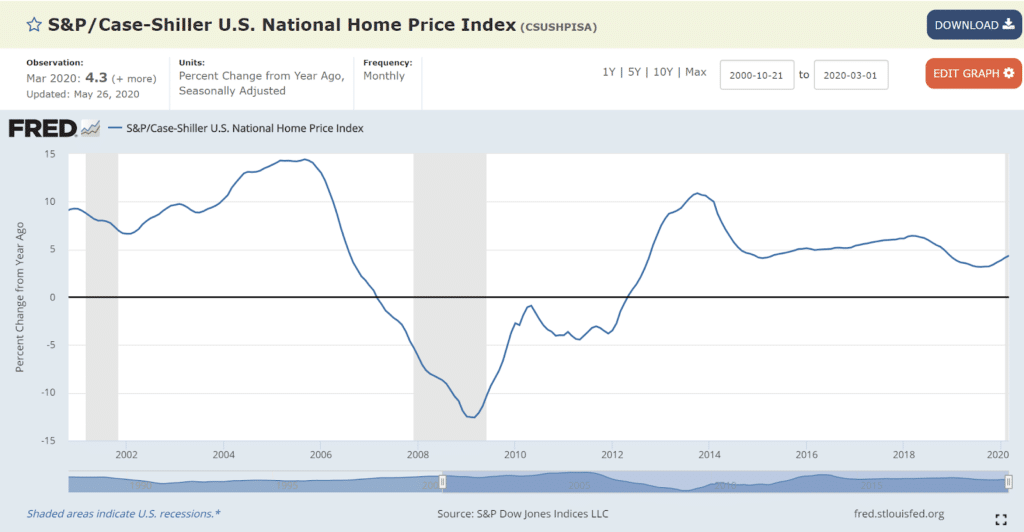
Just look at the real estate market. While part of the performance is driven by short supply, the low-interest rates and store of value from homes fuels higher and higher prices.
That’s why I’ve been taking long positions in the gold miners lately, one of the few strong performers lately.
And looking at the chart, it’s got a good shot of taking out its recent highs.
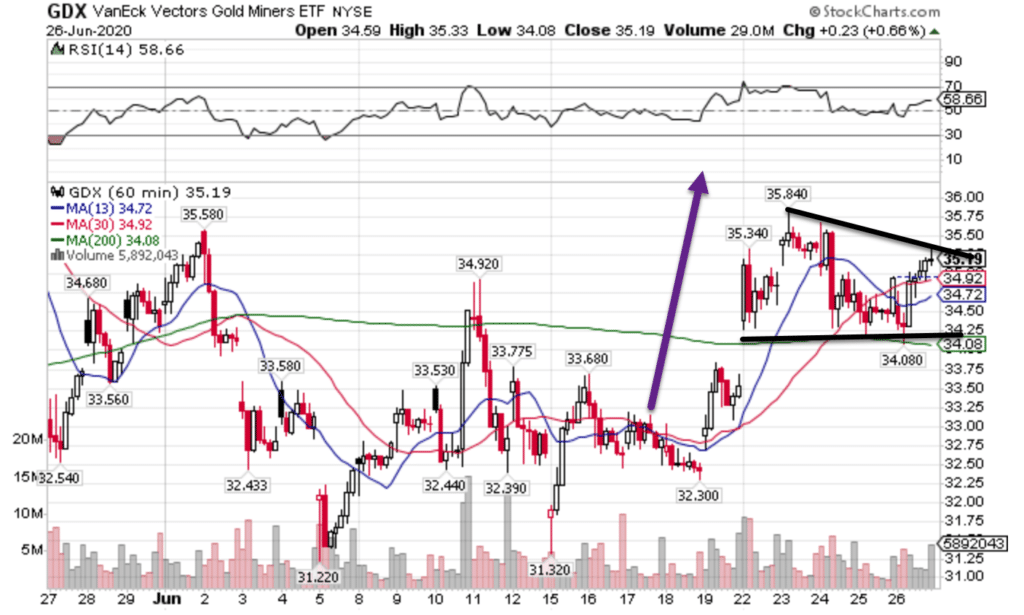
GDX Hourly Chart
Price shot off the bottom, helping some of my call options turn higher. This sideways action right above the 200-period moving average is extremely important.
But enough about the glitzy gold, you want to know where stocks are heading.
Allow me to share with you my thoughts.
A critical moment
Stocks ended last week at the edge of the cliff. They now face a difficult choice – head lower to find support or attempt a recovery from here.
With the holiday fast approaching, it’s a tough call.
Under normal circumstances, I’d expect stocks to fall down to support. However, volume lightens up before holidays, often leading to volatile, but ultimately fruitless price moves.
Take a look at the S&P 500 ETF the SPY.
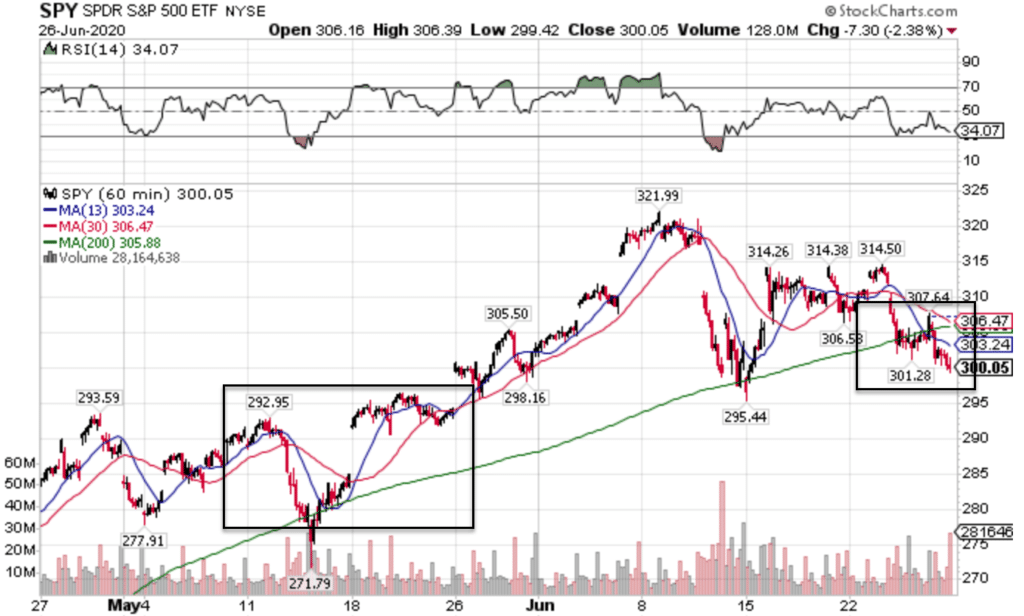
SPY Hourly Chart
Markets had a chance to rally back above the 200-period moving average and failed miserably. I read that as 100% genuine bearish behavior.
The recent lows at $295.44 might act as support, but I doubt it.
Equities simply melted away to end the week. Even the last hour of the day they couldn’t muster any bullishness. Clearly, no one wanted to hold long positions into the weekend.
Now, I’m looking down to the gap window that stretches from $285 to $292.
I know that’s a wide range to work with. But that’s what the market gave us, I don’t make the rules.
Being able to time and trade this market is something I believe needs to be done more in real-time. This includes looking for reversal signals such as a moving average crossover, relative strength movement, as well as keeping a close eye on my favorite indicator – the VIX.
The VIX ain’t looking too pretty
Traditionally, stock prices trade in the opposite direction of the S&P volatility index known as the VIX.
Looking at the VIX hourly chart, I see a bullish pattern in the making.
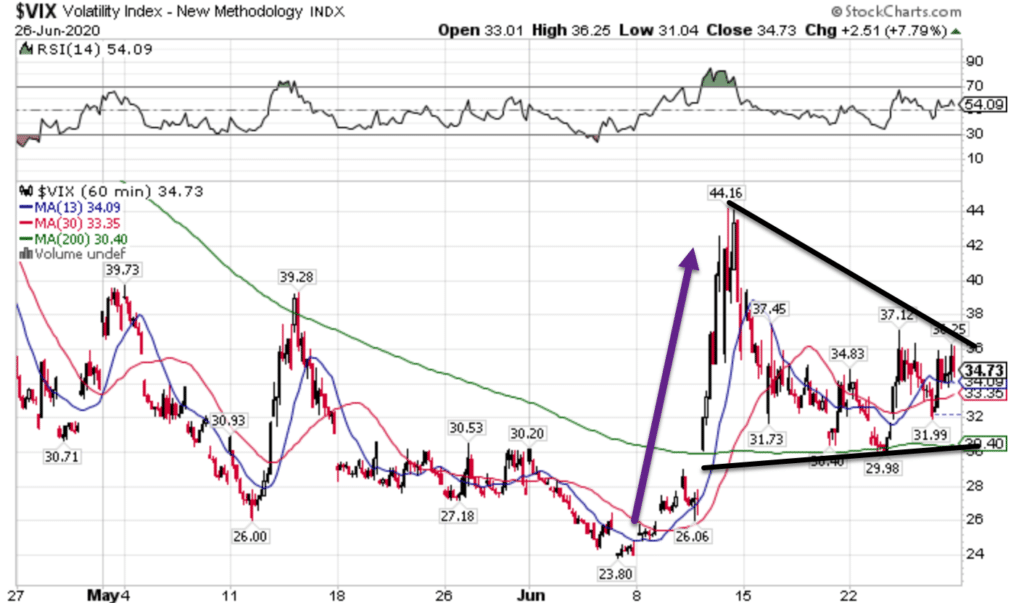
VIX Hourly Chart
Make no mistake, that first bounce indicated by the purple arrow was huge. In fact, it was one of the largest one-day moves in the history of the VIX.
Now that it began making a sideways consolidation, this pennant pattern has all the trappings of a thrust higher.
And again, what do we see?
The important 200-period moving average!
What’s so important about that?
I can tell you, or I can show you.
My Total Alpha Educational Bootcamp is free and explains exactly why I pay attention to this indicator so much. Plus, you’ll learn several other skills critical to trading.
Click here to sign up for my Total Alpha Educational Bootcamp
