Markets don’t make trading easy. They toss us around like a cow in a tornado.

And not even Bill Paxton and Helen Hunt can stop it!
But we all know what happens.
As the markets crash, someone is the last seller, letting go of their shares only to watch things make a hard u-turn.
These levels aren’t easy to spot.
Which is why I want to share with you how I identify them.
Let’s start with one of the easiest to spot – weekly ranges.
Weekly ranges
It sounds too simple to be true. Yet, weekly ranges work much more often than you might realize.
When I say weekly ranges, I’m referring to the four basic components – open, high, low and close.
Here’s what it might look like on a big stock like Apple (AAPL).
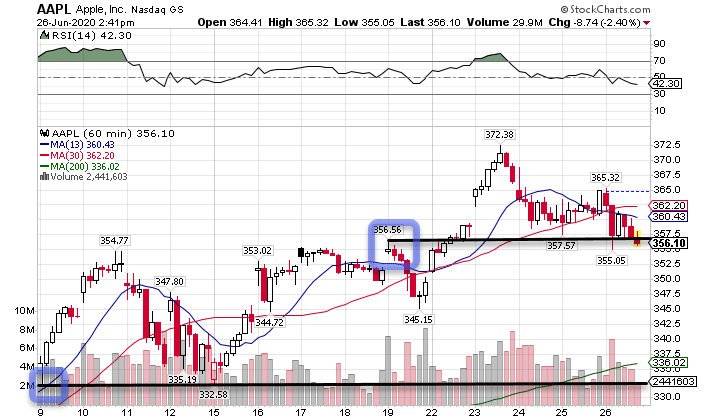
AAPL Hourly Chart
In this example, I marked out the high and the open. You can see how intraweek, the open acted as a support area.
The following week, the high of the previous week acted as support when price dropped down into it.
You probably have heard the saying support broken becomes resistance and resistance broken becomes support.
I found that to be accurate. Check out how the high of the previous week did little more than act as a quick roadblock the next week. However, it certainly became a support area the following week.
Similar to the way I trade my money-pattern, I found the longer price stays away from a support or resistance level, the higher the odds it holds up.
Think of it like the wall the kool-aid man runs through.

After he murders those bricks, it’s going to take someone a long time to put it back together. The longer you keep that red sugar demon away, the more time the mason has to shore up the structure.
Fibonacci retracements
Lots of trading revolves around mathematics. One particularly useful tool is a Fibonacci Retracement.
These retracements take two swing points and calculate levels based on a percentage move between those two points. The most common numbers used are: 23.6%, 31.8%, 50%, 61.8%, and 73.4%.
Here’s a look at how that applies to a recent chart of Johnson & Johnson (JNJ).
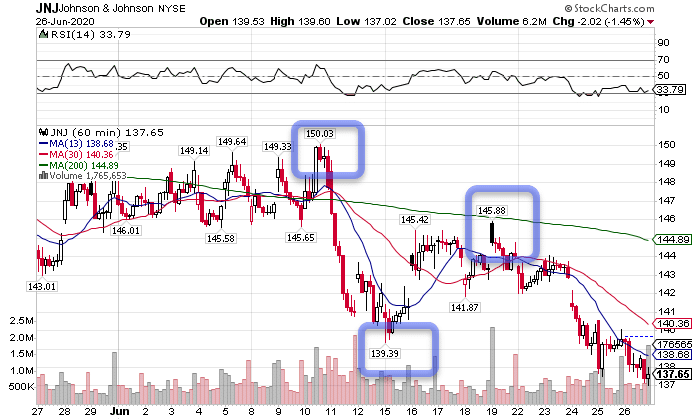
JNJ Hourly Chart
Taking the swing high of $150.03 and low of $139.39, if you backtracked 61.8% of that move you would get a price of $145.96, just a few pennies shy of the third high I noted.
Keep an eye on that green gravitational line because we’re going to come back to that later.
Gap fills
Did you know that 72% of all gaps on the SPY are filled that same day?
When I say a gaps, I’m talking about where the opening price for the SPY is different than the closing price the previous day.
It seems to good to be true, because it is. Backtesting a gap fill strategy would actually lose money because the amount you would win isn’t as much as you’d lose.
However, gaps left open often provide great levels of support or resistance, especially if the stock hasn’t seen them in a few weeks.
Here’s a look at how they worked out with Tesla (TSLA) on several occasions.
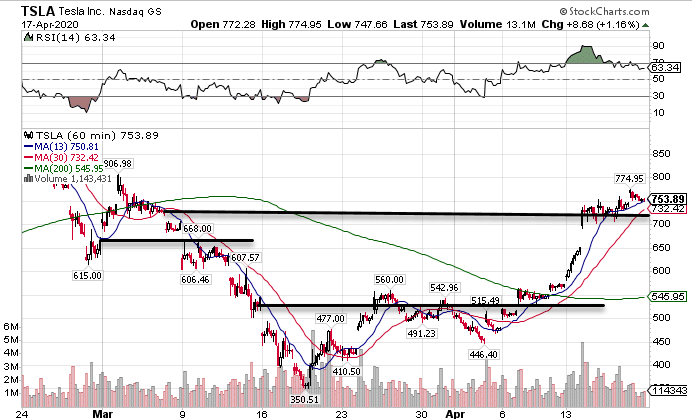
TSLA Hourly Chart
What I found is when a stock jumps over a gap, that gap can still act as support or resistance, just from the opposite direction.
But check out how these gaps were not just important one day, but could lead to consolidation for days.
In fact, the lower line acted as resistance until the shares jumped above it. Then that same level provided support from which Tesla’s stock started a meteoric rise.
Moving averages
One of my all-time favorite ways to find support and resistance is with the 200-period moving average, known as the gravitational line.
Go back up to the Tesla chart and check out how it worked several times.
The 200-period moving average is an extremely common indicator used by traders and chart technicians from retail to professionals. What’s really neat is how it works on different time frames on a variety of charts.
What’s really neat about this indicator is that it isn’t static. Since it’s always calculating the average closing price for the last two hundred periods, it updates every single bar.
Unlike all the other ones I’ve discussed that never change, this one is constantly moving.
Catch up on the gravitational lines
I know after reading this you’re salivating for more. That’s why I created my Total Alpha Bootcamp.
This free workshop goes through concepts and techniques I use for my trading to this day including the gravitational lines as well as my money-pattern, a core element of my High Octane Options trading.
Do yourself a favor and sign up for the class.
Click here to register for the Total Alpha Bootcamp.
