I’m about to lay some hard truth on you.
No one indicator will make you a profitable trader.
Not even my High Octane Options Scanner…
I can’t guarantee you that every trade I take turns a profit. No one can.
But I can give you three tools for your belt:
- How I use this scanner to save tons of time
- Analyzing charts for the right context
- Picking ones with the greatest potential
This newsletter unpacks the key ingredients to putting chart signals in context.
That’s how I take something like this…
And turn it into this…
![]()
One of my larger wins from High Octane Options
So, let’s start by understanding how my High Octane Options Scanner works.
A scanner for the people
What makes my High Octane Options scanner different from everyone else’s? Is there some magic leprechaun that looks deep into the market for the pot of gold?
Hardly. It just happens to scan for my money-pattern crossovers.
While most scanners need to be manually kicked off or scheduled, this one constantly scans the market for my money-pattern.
Being my favorite setup, it immensely cuts down on the time I need to spend sifting through the charts.
Additionally, our Raging Bull developers added bonus features to filter out charts where the cross between the moving averages had been too recent.
Analyzing the charts
Now, I want to review some of the outputs from the High Octane Options scanner and give you some thoughts on them.
As you probably know, not all crossovers are created equal. What defines a tradeable one comes down to a key concept – context.
The context of the trade includes everything from the storyline behind the stock to the longer-term trend behind the chart. Plus, the length of time since the last crossover as well as the price-action in between makes a huge difference.
Let’s take a look at Hormel (HRL).
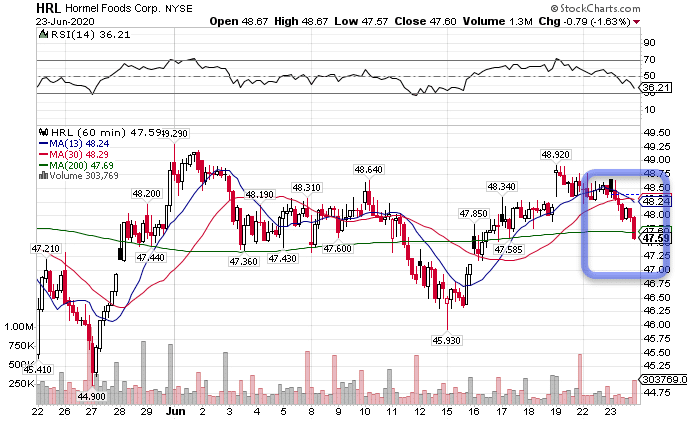
HRL Hourly Chart
Looking at this chart, a few things jump out at me. First, there’s no real trend over the long-term, more sideways action. However, it’s riding the 200-period moving average.
Next, price ran into resistance up near $49, where it previously made a series of attempts to bust through. So, we know that’s a key level.
Lastly, there’s an open gap around $47 that could attract the stock.
As I look at this chart, I’d give it a 4 out of 10 for a short trade. It’s lacking a more pronounced trend reversal. However, the consumer staple stocks haven’t been doing well lately, plus it closed at the dead lows yesterday.
Now, let’s look at another chart, Pinduoduo (PDD).
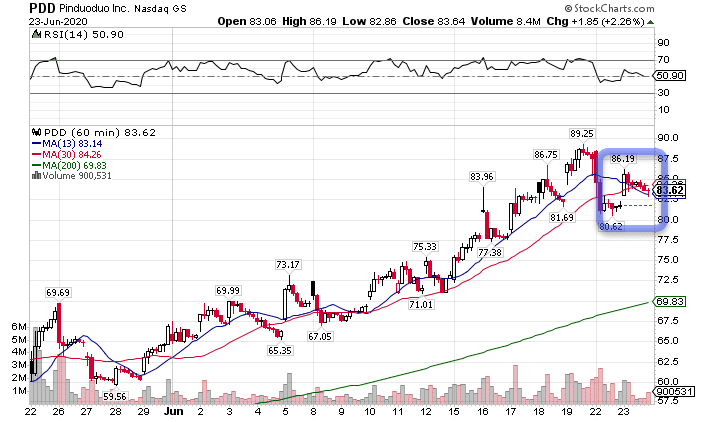
PDD Hourly Chart
I like this one a lot better. There’s a clearer trend that’s reversing, plus a lot of distance until the 200-period moving average.
The only hesitation I have is that dropped lower and then popped back up in between.
I’d rate this one a 6 out of 10. However, I’d be inclined to wait until I saw it drop back down to the recent lows around $80 to ensure it was going to break through.
Here’s a great looking long trade that appeared in Pioneer Resources (PXD).
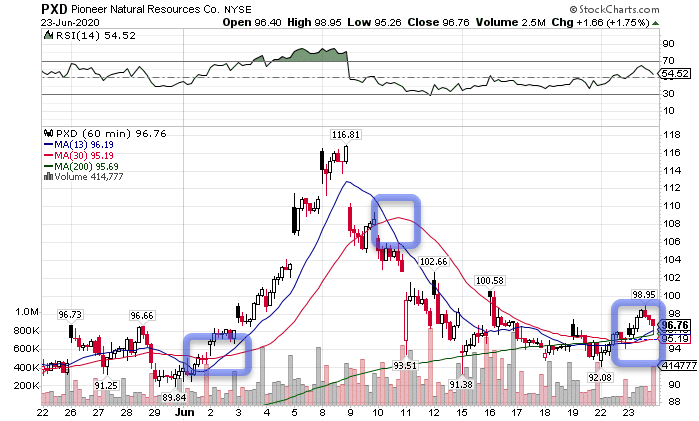
PXD Hourly Chart
There are several things I love about this chart.
First, each of the last crossovers produced clear trend changes. This latest one broke above the recent highs, closed above it, and then retraced into the moving averages.
Second, price held the 200-period moving average and now looks like it’s about to use it as a launchpad.
For this chart, I’d give it an 8 out of 10. This is a beautiful setup since I can stop out below the recent lows which are so close by. This creates a great risk/reward.
And finally, here’s a chart of Cloudfare (NET) which hasn’t crossed in 54 bars.
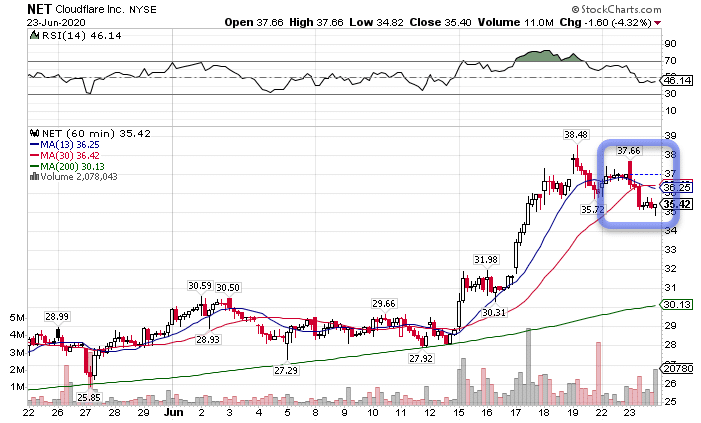
NET Hourly Chart
This one gets a 10 out of 10, and let me explain why.
First, there’s a clear trend that is getting obliterated with this reversal. The stock made a double top and then just fell straight for two days.
Second, it’s now making a bear flag pattern on the hourly chart. That normally leads to lower prices.
With the distance between the current price and the next resistance around $32, this can make a sweet risk/reward as well.
Selecting the highest potential trade
Looking back at these charts, I’m partial to Cloudfare and Pioneer Resources. One is a tech stock, the other energy.
Ideally, I want to align these with the macro markets they reside in.
For example, since Cloudfare is a tech stock, I want to see weakness in the Nasdaq. With Pioneer Resources, I need strength in the energy sector.
Now, these are just a couple of the trades from High Octane Options. I also include special trades that don’t come from the scanner.
So, is High Octane Options right for you?
