Is it possible for markets to fall when everyone expects them to?
Most of the time, I would say no…
But this time is different and here’s why.
While everyone is focused on not fighting the Fed, they’re ignoring obvious warning signs.
Just take a look at the VIX and the bond market…

A danger you can avoid with just a little some basic education
I want to take you through different sets of the market… and highlight exactly what I’m seeing.
And it’s not pretty …unless you’re adequately prepared.
Friday’s close was worse than you think
The vast majority of traders focus on the 4:00 p.m. close. That’s when most of the major market action ceases.
However, there’s still a lot that goes on after hours, especially in the futures markets.
Futures markets aren’t a complicated beast. They’re simply leveraged products that trade around the clock except between 5-6 p.m. EST and from 5 p.m. Friday until 6 p.m. Sunday.
These instruments cover commodities like oil, metals like gold, and stock indexes like the S&P 500.
Simplified – they’re options contracts except you have to take delivery of the product, it’s not an option.
When you turn on CNBC or Bloomberg in the morning and they tell you where markets are set to open, they’re using the current futures market prices.
Now, let me show you what happened Friday at a high level and then break down this aftermarket action.
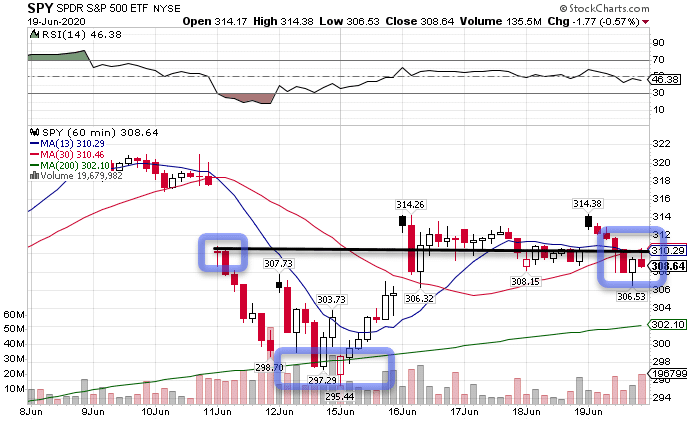
SPY Hourly Chart
Check out the black horizontal line that connects the upper two blue boxes. These enclose the open for last week’s drop around $310, and this week’s close, $308.64.
Despite a rally off the bottom, equities couldn’t close the week out at or above that breakdown resistance point, exhibiting clear weakness.
Now, let me show you the after-hours movement on the SPY (roughly equivalent to the futures price action).
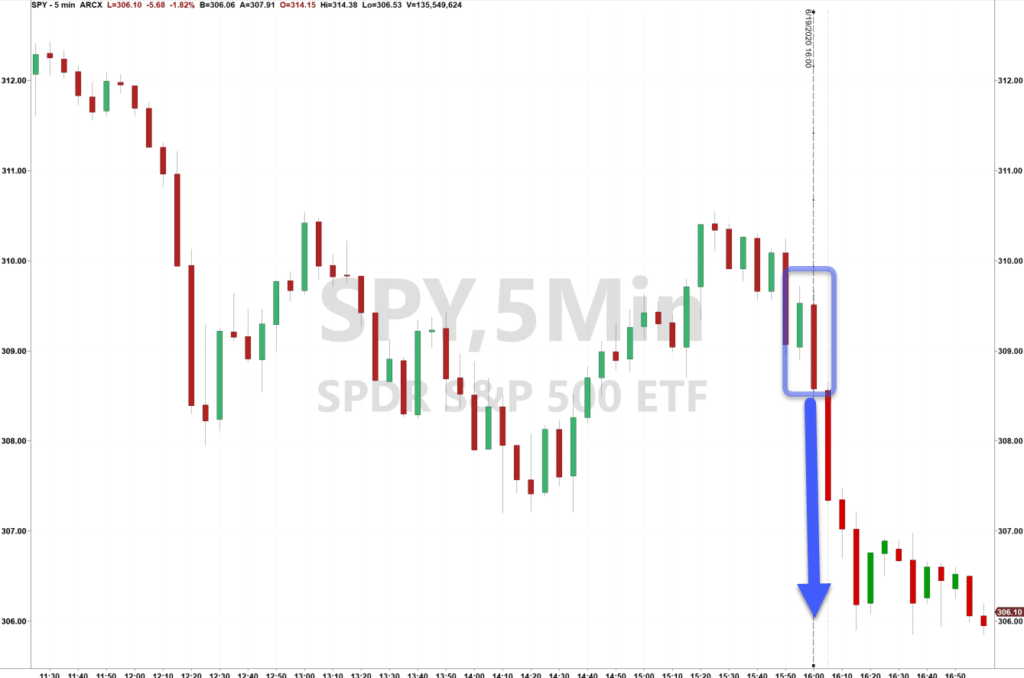
SPY 5-Minute Chart
The blue box shows where the market closed at 4 p.m. After that, equities sold off hard.
The S&P 500 dropped another 25 points, or 250 points in the Dow. If you include the last five minutes of the day, then it would have been 30 points and 300 points.
That means going into the weekend, enough traders didn’t want to hold long positions that their selling pressure dropped the market by 1% in about 30 minutes.
Next, I want to look at volatility, because as an options trader, that’s one of the most important factors.
If you don’t know why that is, click here for a quick training video and I’ll explain.
Beware for whom the VIX tolls
I’ve talked in the past about how important the 200-period moving average is on the hourly chart (AKA Gravitational Lines). These aren’t just important to stocks, but all charts.
On the VIX hourly chart, price began making a consolidation pattern on top of the 200-period moving average that could spell much higher prices.
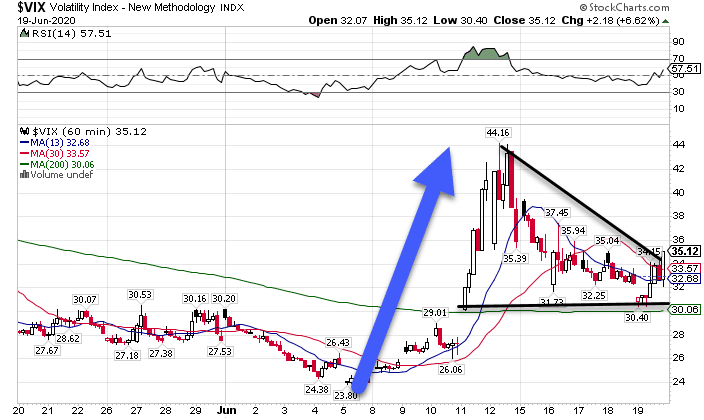
VIX Hourly Chart
Typically, stocks decline when the VIX rises. So, if the VIX is setting up for a potential break higher, that could mean a major decline in stocks.
Beyond the VIX, safety trades are saying ‘Uh Oh!’.
Bonds, gold, and dollar bulls
Most of the time, when stocks sell off, money likes to hide in safety trades like the U.S. dollar, Japanese Yen, gold, and treasuries.
And let me tell you, all of these markets look bullish.
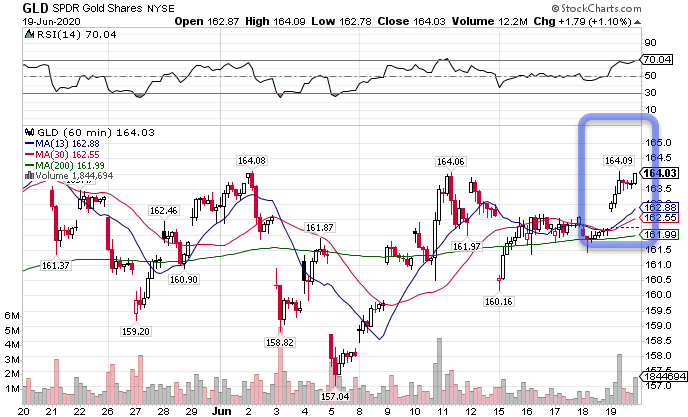
GLD Hourly Chart
Here’s gold getting ready to break out to new highs, pushing ever closer to its all-time highs (which I think they take out in the next few months).
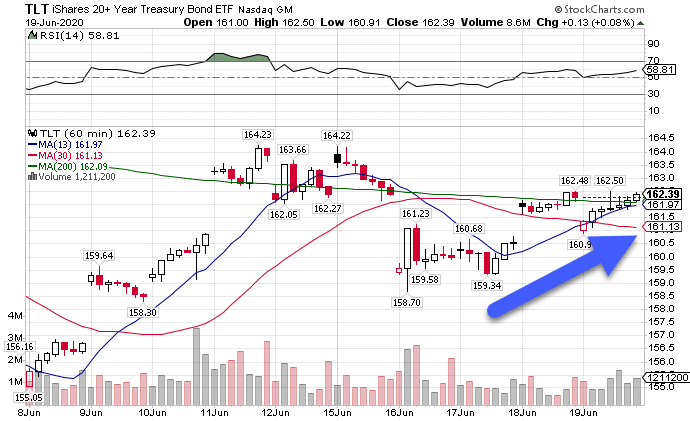
TLT Hourly Chart
Bonds climbed steadily throughout the week, now challenging the 200-period moving average again.
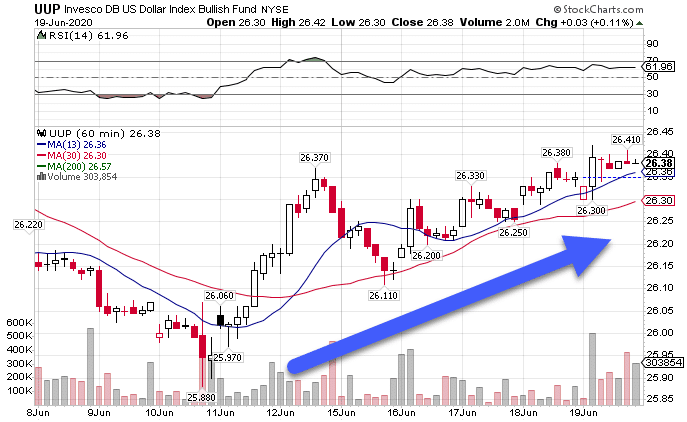
UUP Hourly Chart
And the dollar is nothing if not in an uptrend. Every time it hits the 13 or 30-period moving average, it springs back into action.
Rarely do safety trades and equities move in the same direction for very long. At some point, one of them is going to be wrong.
My money is on stocks missing the boat on this one.
Here’s how I’m trading this turn
So far, I’ve kept my longer-term trades bearish and short-term trades bullish. Friday, I cleaned up a lot of the long positions, only keeping what I felt were my best options plays.
This week, there’s going to be huge opportunities for me to make money to the short-side.
That’s why I’m prepping my Total Alpha members with the best training I have to set them up for success.
And now, you can get in on it too.
Learn some of my favorite techniques and tips with my Options Masterclass.
