Well, my first set of High Octane trades produced some pretty amazing results.
The very first alert for High Octane Options- A $16k Winner
I quickly followed that with another win in Expedia…
What is that I’m doing to knock these trades out of the park…
And most importantly, what can you learn from to replicate this type of success?
I’m about to break it all down for you…
I’ll walk you through the mechanics of how I set up my targets…
To how I manage the trades…
What are the High Octane Options?
It’s no secret that we’ve seen a lot of volatility recently. With swings of hundreds to thousands of points, we’re in one of the best directional trading markets in my lifetime.
So, how could I pass up the chance to spread the love?
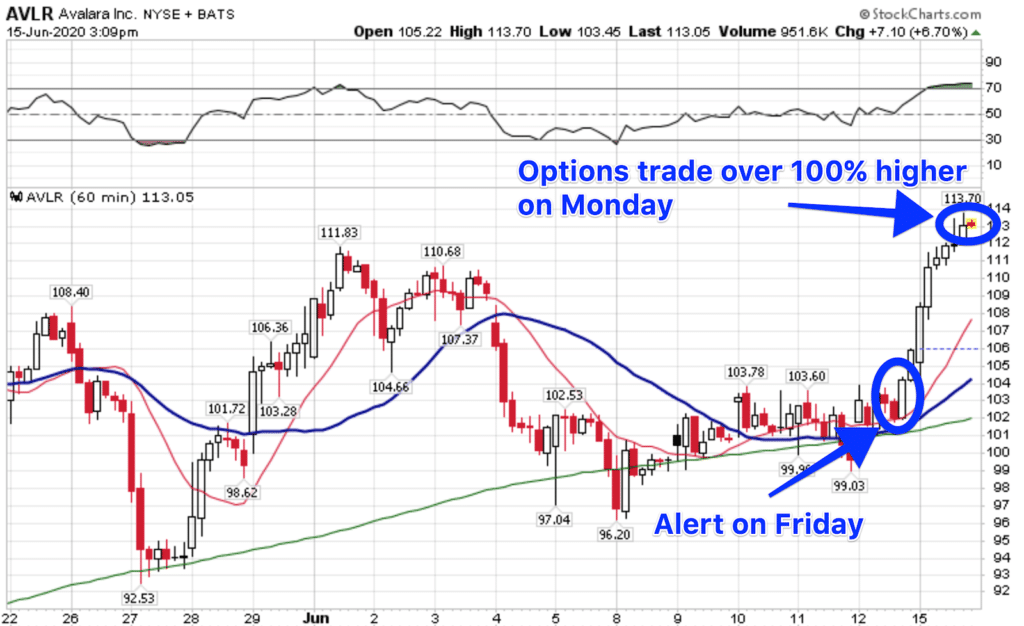
High Octane Options use my proprietary scanner that scours for one of my favorite setups – the money-pattern.
For those of you who aren’t familiar with this setup, allow me to explain.
The money-pattern happens on the hourly chart. Using the 13-period simple moving average and the 30-period moving average, I plot them and look for places where they cross.
When I see the two cross, and it’s been at least a couple of weeks since the last time. I take this as a potential signal for a trend change.
What does this pattern look like?
Well, you can see it in one of the largest ETFs in the world, the SPY.

SPY Hourly Chart
Check out what happens with the crossover. At the end of the day, you finally see the moving averages touch.
The very next day, stocks gap down and bulls get smoked.
Did the crossover cause the chart to go down?
Probably not.
However, it did indicate a change in trend. One that I capitalized on to the tune of nearly $300,000.
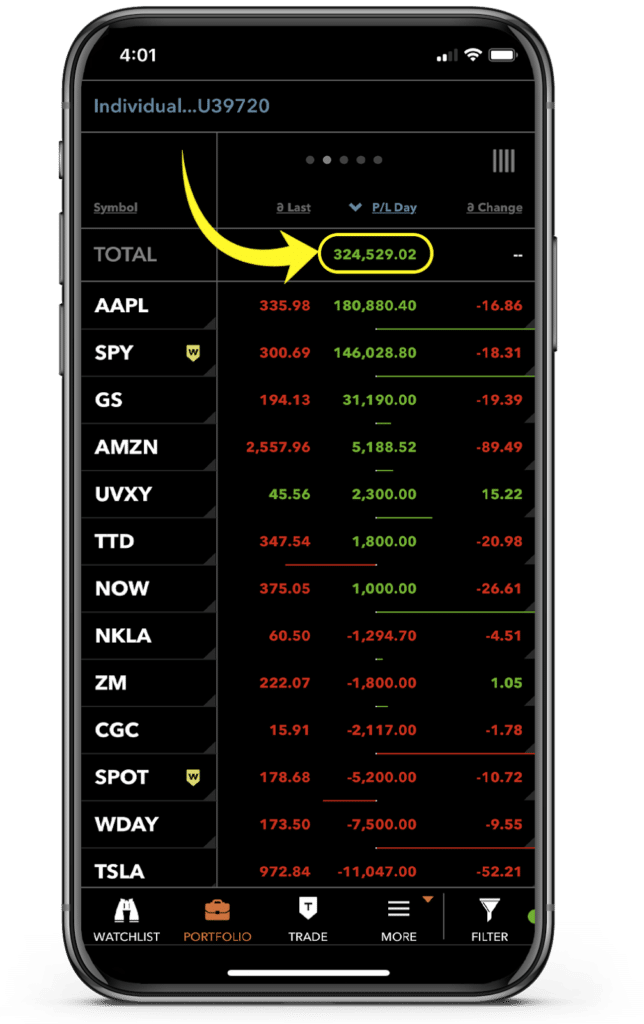
Most of the gains in that portfolio were off of short positions I took in liquid stocks like the SPY, Apple, and Goldman Sachs.
Now that we’re familiar with the setup, let’s talk about how I set up the mechanics of this trade.
Playing to win
Let’s go back to the chart of the SPY for a minute. I want you to note the closing price before the drop (where the crossover occurred) and the high.
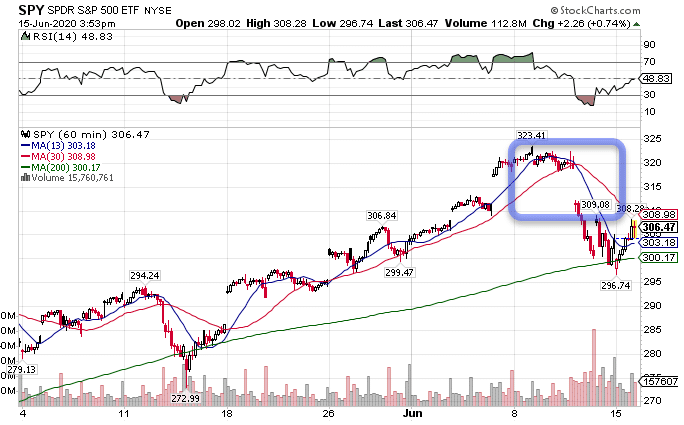
SPY Hourly Chart
The crossover occurred around $320, with the recent high around $323.41.
Will these patterns always work out?
Heck no!
However, I added in some qualitative analysis that showed a higher than usual chance of success.
But let’s assume for a moment that I had a 50/50 shot of this working out.
Naturally, I want to stop out of the trade above the old high. Let’s round that to $323.50.
My entry would be $320.
The difference between the two is $3.50.
In order to make money over time, I need to do better than $320- $3.50 = $316.50. That way, even if I have a coin flip chance, I’m always winning more than I’m losing.
If you took this pattern totally on its own, with no context, I’d venture to say it works out about 60% of the time. With my intermarket analysis and macroeconomic outlook, I would have said the odds increased to closer to 70%-75%.
Note: There is no way to know for certain. This is based on my estimation from experience. You can journal your own setups (or even this one) and log how often they work out to get your own statistics.
Now, I also know that the 200-period moving average tends to be a magnet that draws price to it. With the moving average close to $300, a big round number, I saw the following:
- My risk was around $3.50 (maybe $4 if I pushed it).
- The potential upside was nearly $20, almost 5x the risk
- I expected my odds of success to be much greater than 50%
All of this created an edge that I sought to maximize. That’s why I bought directional puts on the SPY, AAPL, and GS that led to my biggest gain of the year.
Are there more trades out there?
You bet there are!
I know it’s difficult to not just find the patterns, but consider their context to make sure you’re trading quality setups.
That’s why you need to consider High Octane Options. With a proprietary scanner that pulls out setups, I’m constantly reviewing charts and letting you know which trades I think are prime for the picking.
So check it out for yourself.
Click here to learn more about High Octane Options.
