Markets left a lot of folks scratching their heads on Friday.
It looked like we were about to fall off a cliff.
Then the bulls came to the rescue to keep things from completely falling apart.
But as you can see today…
The tug of war continues… with the bears taking back command.
Now the million dollar question – where do we go from here?
There’s a lot of conflicting signals out there.
That’s why I wanted to give you a first look at my technical analysis of the markets.
Because if we’re headed for another leg lower, then I want to get on top of some High Octane Options just like these Goldman Sachs (GS) puts from last week.
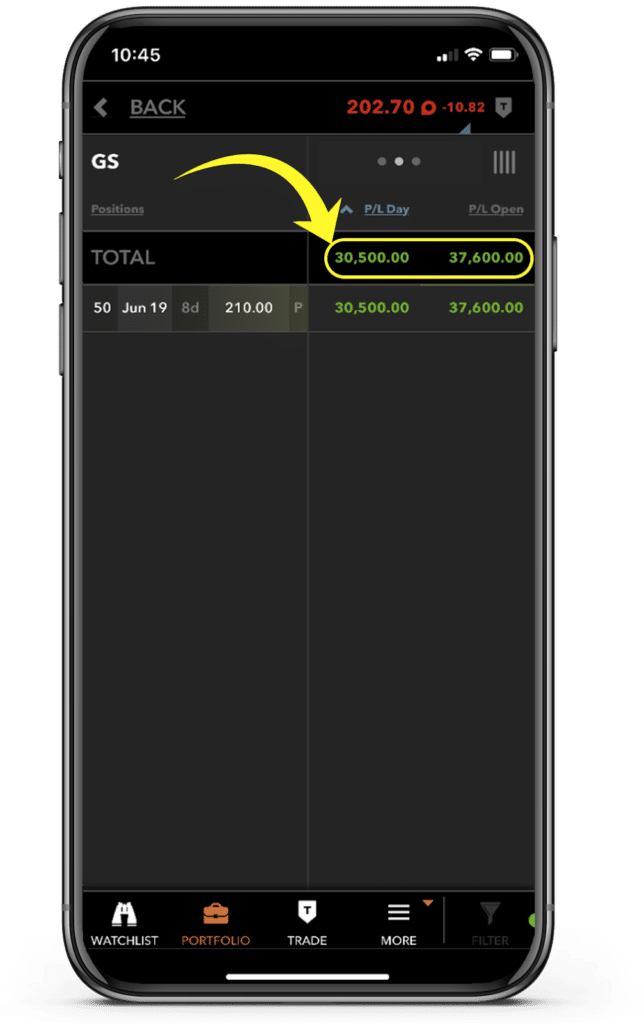
Not too shabby for a couple days worth of work!
To start, I want to take a look at the S&P 500.
I SPY with my little eye
I want to focus on the hourly chart of the SPY ETF and point out two key developments.
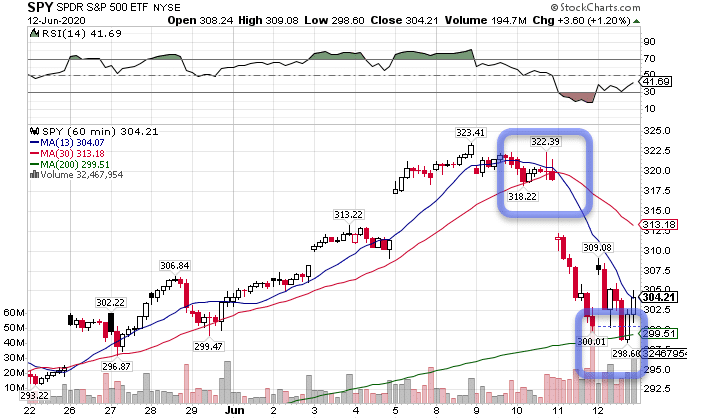
SPY Hourly Chart
In the upper box, you’ll see how the blue line (the 13-period moving average) crossed below the red line (the 30-period moving average).
This particular crossover is what the High Octane Options scanner looks for. Typically, I want the two to not touch for about two weeks, which happened in this case.
When you see the faster moving average (13-period) cross below the slower one (30-period), it indicates a shift in the trend.
While this is more common on individual stocks, when it happens on a market index, it’s worth paying close attention to.
Last week’s huge gains came off of this signal, telling me that I wanted to short the market. However, the actual crossover didn’t occur until the very end of the day.
Anticipating this, I added a handful of trades against the market by buying put options (bets stocks would go down) ahead of the close.
Keep this chart in your notebook. It’s almost as close to a picture-perfect setup as possible.
Setting up the trade
One of my favorite sayings – trading is an exercise in probabilities and risk management.
Not every trade will work out.
In fact, most traders, at the high end, will win about 75% of their trades. It’s a balance between the win-rate and your risk vs reward that determines your success.
For me, the trade and pattern are broken when price starts closing back above both the moving averages or the highs right before the breakdown.
Normally, we’ll see price drop, find support, then come back into the moving averages before continuing its move.
If I can’t get ahead of the initial move (like I did in this case), this retracement a potential secondary entry point, again using the same stops.
For targets, I consider two pieces of information.
First, where is price likely to find support or resistance?
In this case, it already used the 200-period moving average (AKA the gravitational line) as support. Next time it visits that moving average, it’s less likely to hold price back.
Second, I look at what I need to earn in order to make the trade profitable. That’s where the concept of expected value comes in.
You can find more about this on page 61 of the Traders Black Book here.
This tells me what I should make on average if I play the same trade over and over.
For example – if I have a 50% chance of winning or losing, I need to make slightly more than I would be risking to make money over time.
Taking that into account, I want to find an entry that gives me the correct balance for the risk (potential losses) to the reward (profits) while considering the win-rate.
If this is confusing to you right now, don’t worry. We’ve got plenty of time together, and I’m going to explain many different ways to help you explain it to all your friends at cocktail parties.
My outlook for the week
Withe bearish crossover, I now want to focus on the second development – the 200-period moving average (green line).

SPY Hourly Chart
That’s what you see in the second box at the bottom.
Normally, that provides support or resistance for at least a few days.
However, price already ran into the 13-period moving average.
So, we’ve got two possible scenarios I see.
First, stocks open up higher on Monday, gapping over the 13-period moving average. From there, I expect them to fight back to the 30-period moving average and the open of last Thursday around $312-$313.
At that point, the market should find resistance and decide whether it wants to take its next plunge lower, or potentially move sideways to higher to try to retest the highs.
I find it unlikely we’re going to retest the highs anytime soon. However, next week is options expiration week, so we can see expanded volatility and price movement. That can push stocks slightly higher or lower than the support and resistance levels.
Our second scenario is a failure of the 200-period moving average. That would see stocks open flat to severely lower on Monday, creating a slide down to around $294 on the SPY.
Ready to supercharge your portfolio?
The only place to catch these explosive trades is with High Octane Options.
