This past week, I had one of my Highest Octane Trades for the year.
However, I’m not sharing this to brag with you.
Not at all.
Instead, I’ve decided to breakdown the mechanics of the trades, the thought process I applied, and which tools I used to gain conviction.
Six-figure trading days might not be possible for you yet…
But that can be… if you study, and take these lessons to heart.
Types of signals
Imagine you’re coming up to a busy intersection. The sun is in your eyes. You want to make a right turn on red.
The cars coming from the left are partially blocked by a bunch of bushes and trees.
Ohh, and it’s raining.
Put all of that together, and you’ve got higher odds of an accident than normal.
All those different signals come together to tell you – Hey Jeff Speed Racer Bishop…maybe wait until you get a green to make the turn.
Trading signals work the same way. Believe it or not, you’ve got several out there that come from different places.
- Timing – These signals can be moving averages, time of day, number of days up/down in a row, or a chart pattern that says a price move is imminent.
- Levels – Here we have support and resistance areas that come in the form of swing points, areas of consolidation, and even moving averages again (they’re quite versatile).
- Context – Of all the signals, content is the hardest. It involves looking at the trade in the scope of various storylines and themes going on. The recent stay-at-home trade is a good example.
Some signals cross between categories. Where they belong all depends on how you plan to use them.
Now, let’s take a look at how these can be put together to increase the trading odds.
Combining signals
I briefly discussed how I push my edge to maximize profits. One of the distinct ways I do that is by creating trades with multiple signals.
As I mentioned in the previous article, think of all the different types of traders out there.
If you pick a trade that they’re all looking at at the same time, then you’re more likely to get the result you want than if you only had one signal.
Taking this a step further, I like to pick out signals from the different categories above. It’s kind of like signal diversification.
Picking out unrelated signals avoids an overlap of bias between various indicators.
For example, a lot of traders will use moving averages and trend following together. That’s what’s known as indicator overlap.
However, it’s much less likely to see someone use time of day (such as traders who specialize on the open) and moving-averages.
Let me show you what I mean through the example I led with.
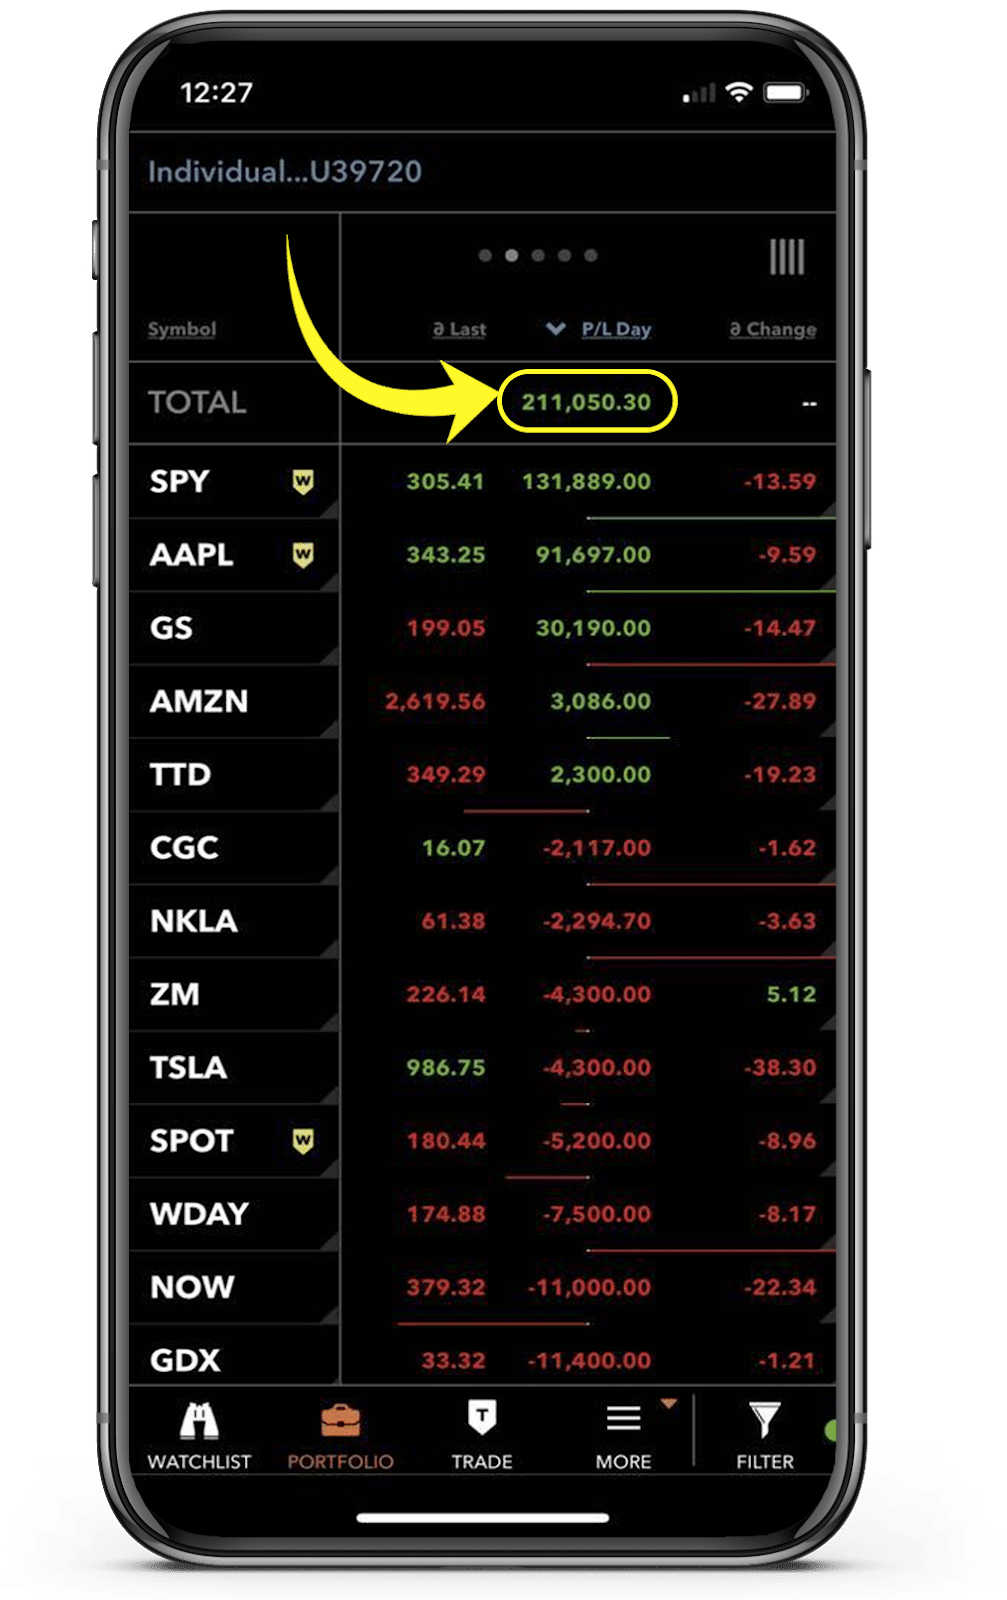
How I scored $200K+
Let’s start with the context. The economic backdrop for the world is bleak. Even though states and countries have begun to reopen, activity remains depressed.
Yet, the market ran straight off the lows in March to all-time highs in some cases. Companies like Apple, who hadn’t even opened up their stores, were hitting all-time highs.
Next, we had a Fed announcement coming up. With most of the arrows fired from their quiver, there wasn’t much they could say that would make a difference.
It created the common ‘buy the rumor sell the news’ setup, with the Fed announcement being the inflection point.
On top of that, by the end of the day, the SPY created a chart that looked like this:
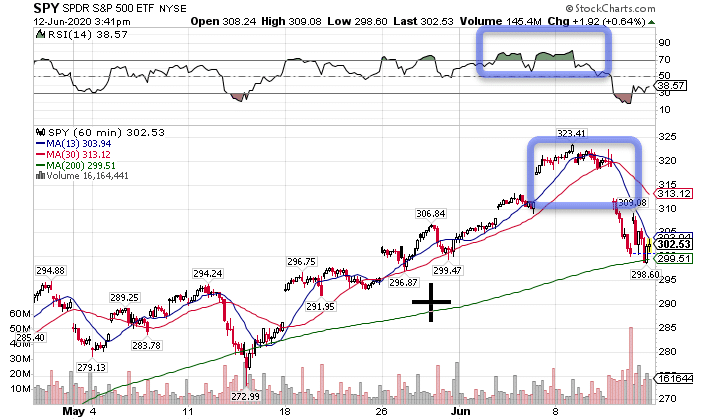
SPY Hourly Chart
Here I’ve got two technical indicators telling me something is up. First, the relative strength index (RSI) shows overbought. Second, the 13-period moving average is starting to cross over the 30-period moving average – one of my key signals for High Octane Options.
All of these led me to believe there was an epic opportunity to short the market here.
And short the market I did.
Now trades like this aren’t as rare as you think. In fact, I created a scanner to help me narrow down the list to some of my favorite setups.
This resulted in my High Octane Options. Driven by a proprietary scanner, I combine technical analysis with context and macroeconomic analysis to deliver trades to you every day.
Click here to learn more about High Octane Options.
