We all know that person who gloats about picking the one green stock— the day there’s a sea of red.
Well, guess who spiked a win in Boeing (BA) last week and walks around in stolen bathrobes?

As part of my court-mandated community service, I’m going to unpack this entire trade from inception to execution.
What’s especially interesting is how this ties in almost perfectly with the fourth lesson from my fourth options masterclass…which you can register for by clicking here.
Now, onto Boeing!
The power of gravitational lines
Recently, I wrote about how gravitational lines can be used as powerful trading tools on the hourly chart. It’s one of my favorite technical indicators to use across any instrument.
As a quick recap, gravitational lines are the 200-period simple moving average on the hourly chart.
Up to this point, I’ve talked about them as support and resistance. However, this trick is a little twist on that.
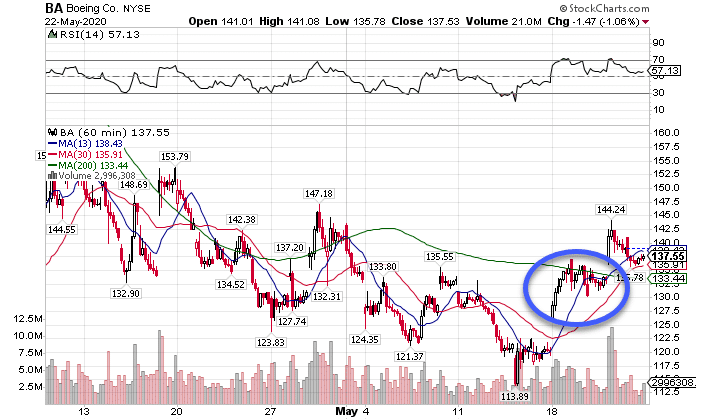
Take a look at the chart below.

BA Hourly Chart
In the circle is the area that I traded off of to swing Boeing (BA) to the upside.
But how is it that I used resistance to set up a long trade?
That’s where the fun comes in.
You see, when stocks consolidate above or below support or resistance areas and making continuation patterns, typically that’s a sign they’re about to bust through.
Let’s dig in a little further into what I’m talking about.
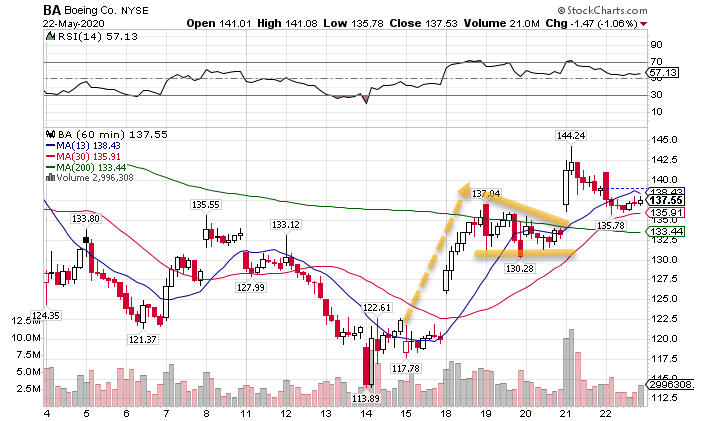
Check out the chart here that lays out the continuation pattern.

BA Hourly Chart
First, we have a pretty big reversal on the 14th that happened on higher than normal volume. From there, price consolidated for a day before taking off to the upside, right into gravitational line.
As you might expect, that acted as resistance – so far so good.
What’s important is what the stock did after that. If it wanted to head lower, it would have created a reversal pattern and headed back down. However, that didn’t happen.
Instead, price stayed around $132.50-$135 for several more days. During that time, price began trading in a narrowing channel.
Looking at the solid orange trendlines, you can see how they start to converge towards one another. These were drawn using the highs of the candles and the lows (doesn’t have to be perfect).
When you combine that with the push off the bottom into that area, you get a pennant continuation pattern.
Here’s the trick – when this happens under an obviously important level, price tends to pop above there rather quickly.
So, that’s what I expected.
The trade setup
Now, a lot of folks might wonder why I played a put credit spread instead of buying call options. Let’s look at the differences.
You can learn more about credit spreads in my recent blog post by clicking here.
Long call options are plays that can pay out big. However, you have to get the timing right, the move has to be big enough, and – this is most important – implied volatility needs to remain the same or expand.
You see, option prices are composed of three components – time to expiration, distance between the strike price and current price, and implied volatility.
Implied volatility happens to be mean-reverting, which means that there’s a high likelihood that extreme readings move back towards normal ones.
Now, implied volatility for this trade was very high. So, if I did the trade by buying a call option, IV decreases could potentially work against me. Plus, I didn’t think the price movement would be that big.
Instead, I went with a put credit spread. This defined risk trade paid me $5 for every spread I put on. The maximum I could make was that $5 and my potential loss was $15 per spread.
As a seller of options, I want the stock to stay above the put strikes so that they expire worthless. That lets me keep the $5 per spread.
In this case I sold the $130 puts and bought the $128 puts expiring in two days. All I needed was Boeing to close above $130 on Friday (which it closed at $137.53). However, I could always take the trade off at partial profit early.
Once the stock jumped up on Thursday, I took the majority of the trade off and locked in my profits. The remainder I closed out on Friday close to maximum profit.
All of this happened as stocks fell apart at the same time. That’s the POWER of technical analysis.
And it’s also a great segue into my fourth lesson in the Total Alpha Masterclass – a stock’s lifecycle.
Do yourself a favor – sign up for this class and see if you can figure out how that fourth lesson would apply to this trade.
Click here to sign up for my Options Masterclass
