Forgive me, but I’m going to get a little technical with you today.
We’re going to be talking about an essential concept in options trading…
And while you don’t have to master it to make money in the options market…
But if you can, you’ll be nearly unstoppable, opening up a window of trading opportunities…
You never knew existed…
Allow me to start with the question…
How much do you think you know about implied volatility?
Did you know that it’s different for every single option contract?
It’s the CRUCIAL element in the options pricing model…
And one you MUST understand if you ever want to get in the business of selling options premium…
…which is why I’m going to not just show you how to read an option chain but also how USE IT TO YOUR ADVANTAGE!
Most traders know that an increase in implied volatility drives up the price of an option.
So, how is it so many traders enter positions that work against them?
It’s because they don’t look at the individual contracts to verify their assumptions.
I wouldn’t jump into this $10,000 Total Alpha position without knowing my stuff!
If you’re somewhat lost…
Stick with me, because I don’t expect you to get this on your first shot.
But if you want to fast track your progress as an options trader then this a lesson you can’t afford to skip.
Today I’m going to teach you the ins and outs of implied volatility, how to read an options trading, and how you can apply this information to making better trading decisions.
Implied Volatility Basics
Three things make up price of an option: the distance between current price and the strike price, time until expiration, and implied volatility. The first two are easily understood, while second one is a little different.
You see, implied volatility measures trader expectations for the stock’s movement expressed as a percentage. Through analyzing demand on an option, we can figure out the annualized expectation for price movement.
Let’s step back for a moment and think about implied volatility as ‘uncertainty.’ Imagine you were selling insurance. Typically, the longer you hold open a policy for someone, the riskier it would be.
So, in most cases, you would expect the uncertainty to be higher with more time.
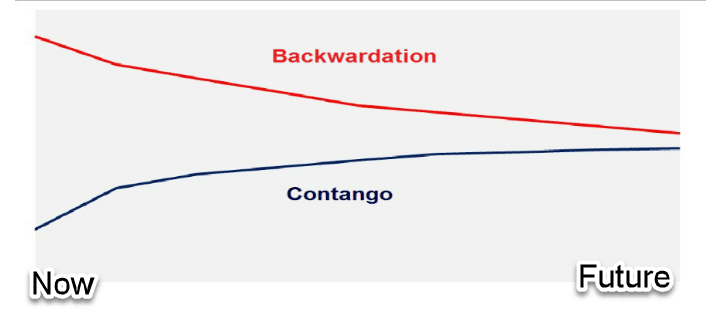
Option contracts tend to assume the same thing. This creates a condition known as Contango. In this context, contango means that the implied volatility is higher on option contracts the further you get from expiration.
The opposite of that is known as Backwardation.
Here’s a quick diagram to help you visualize the concept.
When I go out and sell options in the future, assuming the stock remains at the same price, I have two things working in my favor – time decay and implied volatility decay.
Time decay is a given that occurs as long as there is extrinsic value. Implied volatility decay only occurs when options are in Contango (implied volatility is higher further out).
Otherwise, an option contract’s time decay is partially or fully offset by increases in implied volatility. That may be great for option buyers, but it sucks for option sellers.
Now, most traders understand this concept. However, with the crash in the market this year, volatility went into backwardation. Traders feared what was happening next week, but figured it would work itself out over time.
Reading the options chain
As promised, I want to show you how to read the option chain to understand this concept. Let’s use the SPY as our example.
SPY Option Chain
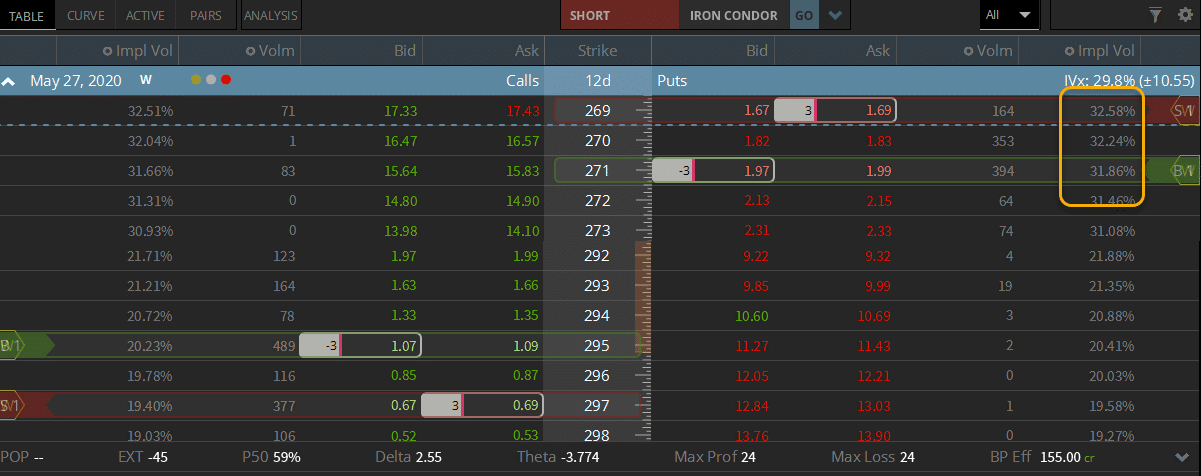
In this option chain you have the call options on the left and puts on the right. I highlighted several things.
First, you’ll see the column for implied volatility at the top. In the middle are the days until expiration and the strike prices. Both of these are boxed in white.
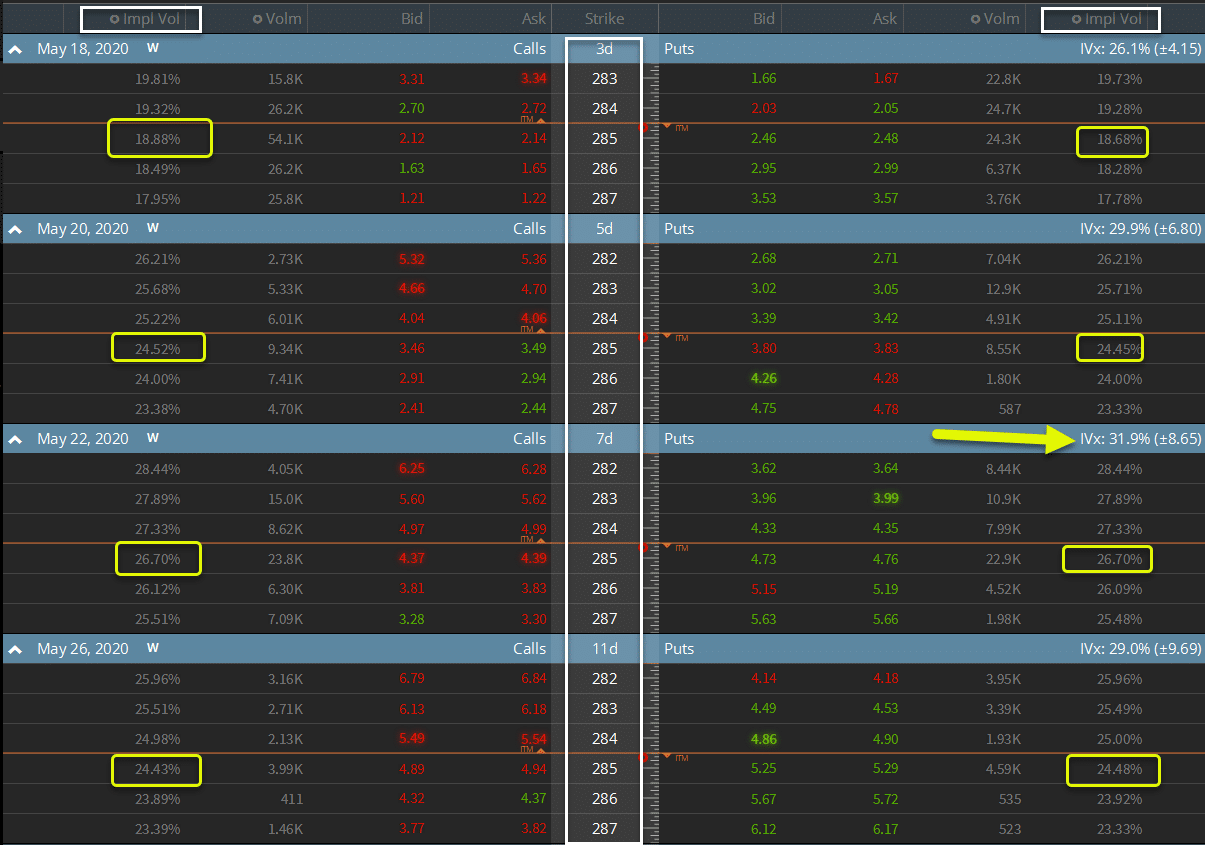
Now, the yellow boxes running vertically circle the implied volatility on the $285 strike price across the different expiration dates. This is the annualized volatility, not how much they expect it to move by that week.
Annualized volatility is where you take a movement of say 1% expected over the next week and extrapolate it to be 52% over the year. This chain would display 52%.
For the most part, on both calls and puts, the implied volatility percentage declines as you get closer to expiration…execpt in one case. The May 22nd options have higher implied volatility than the May 26th options.
That means if I bought the $285 calls or puts for May 26th, and everything else stays the same, they would be worth more four days later because if the increase in implied volatility.
As an option seller, I want implied volatility to work with me. So, I want to see implied volatility decrease over time.
Buyers want the opposite.
Applying to trading
Understanding this, when I look to sell option contracts, I want to make sure that I pick ones that consistently have declines in implied volatility as expiration nears.
Can this be upended at any time? Of course. Conditions can and do change.
However, I can only work with the best information I have at the time. And if I wanted to sell SPY options, I would avoid doing it 11 days out. But if I was buying options, that would be a nice place to start.
This is a crucial step that most traders overlook. They hear on t.v. that volatility is normal and don’t bother to check their individual trades.
Even if the market is normal on the whole, individual trades can vary.
That’s why a good place to start learning is with my free training video – The Ultimate Guide to Options Trading.
Here you’ll get the foundational elements that I use in my trading every day.