Most of us still can’t go to a movie theater or even get a haircut.
However, it doesn’t seem to bother investors, as stocks ready themselves to climb ever higher this week.
Massive gains await but…
Only if you play your cards right.
By far, the Nasdaq 100 has led this rally, closing in on its old all-time highs.
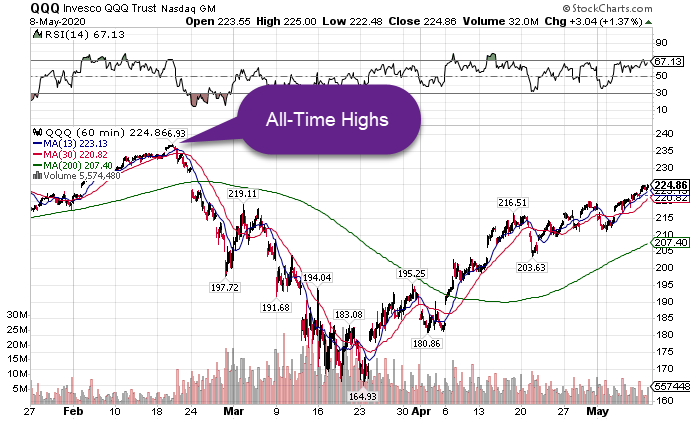
QQQ Hourly Chart
That said, some of the most beaten-down sectors are coiled, ready to spring into action.
Which ones?
I’ve put together the six most important charts that you should be paying attention to this week.
Pilot to co-pilot: ready for takeoff
Ever so slowly, and as quiet as the abandoned airports, airlines found a bottom while most of us weren’t looking.
And now, they look like they’re ready to rip higher, which could lead to some ridiculous gains.
Take a look at the JETS ETF that tracks a basket of airline stocks.
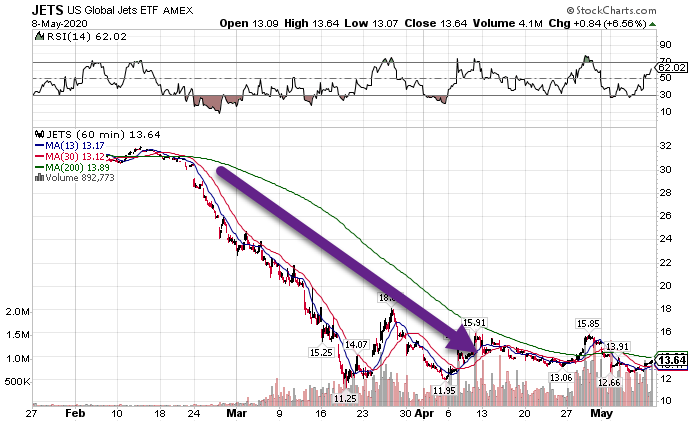
JETS Hourly Chart
This ETF didn’t just fall, it got clobbered, losing over 2/3rds of its value. Even Warren Buffett threw in the towel.
When I hear that, I think capitulation – a point where everyone who’s sold has sold.
Plus, a closer look at the hourly chart shows a nice bullish pattern forming.
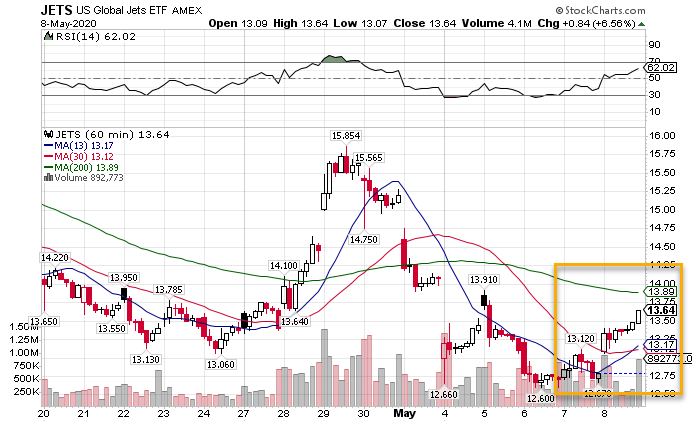
JETS Hourly Chart
Not only do we have a potential money-pattern crossover taking place, but a nice flag consolidation breaking to the upside.
You can see that formation with the large up candle, followed by smaller candles that keep shrinking. Then, price started to push higher to close out Friday.
Rising oil prices should be hurting airlines as it’s one of their largest input costs. However, the prospects of actually opening back up for business seems to be more enticing.
Slick Willy does it again
Speaking of crude oil, it’s made one heck of a recovery. Driven by…well drivers hitting the road again, crude oil managed to pull itself up above $20 a barrel.
Plus, in a sign of stabilization, the USO ETF hasn’t had to halt trading to deal with solvency issues in over a week…so that’s something.
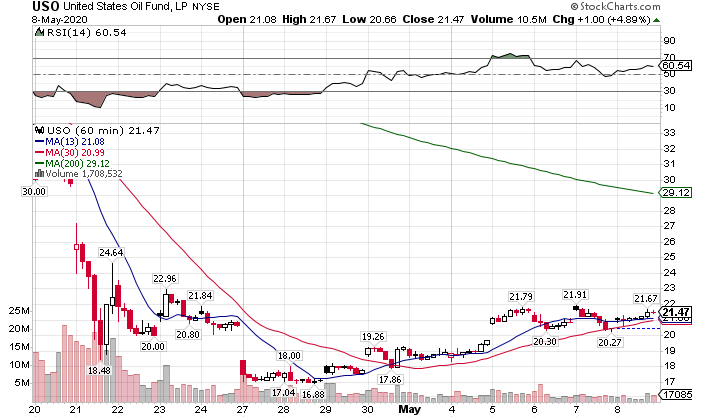
USO Hourly Chart
In fact, we’ve seen energy names steadily rise with the improvement in crude oil prices. The XLE energy ETF is knocking up against a resistance ceiling, looking like it wants to pop out and say hello.
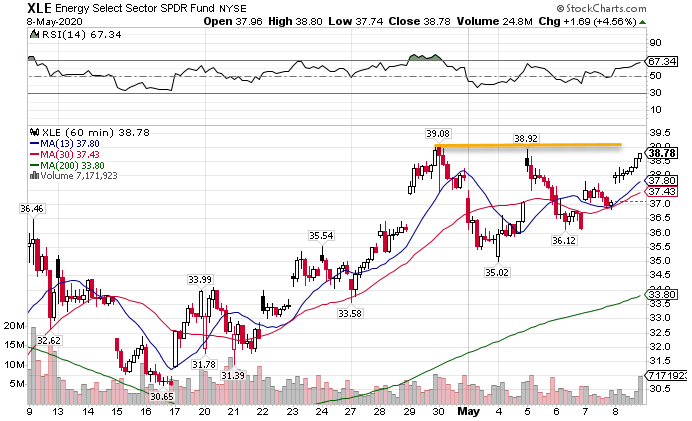
XLE Hourly Chart
Now, you might think with all this bullishness that the safety trades would be off the table. But, they aren’t all created equal.
It’s gold bro
The gold trade continues to work no matter how high the stock market rides. Typically, investors flee to the precious metal when they want to hide from falling stocks.
However, something else seems to be at work here. Despite stocks retracing a massive portion of their decline, the GLD ETF keeps moving sideways.
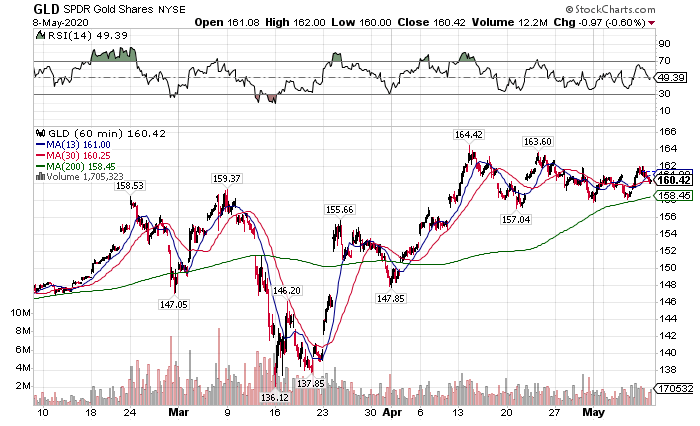
GLD Hourly Chart
In fact, looking at this hourly chart, as long as gold holds the 200-period moving average (green line), then I think it can challenge its all-time highs.
On the flip side, bonds may be starting to lose a little of their luster. After an insane Fed induced buying binge, the long end of the yield curve appears to be fading.
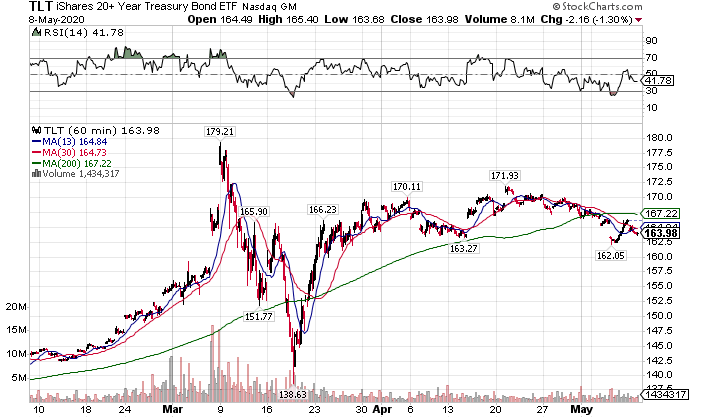
TLT Hourly Chart
Unlike gold, bonds fell below the 200-period moving average and broke below the most recent swing low.
This might be related to the Federal Reserve pulling back on its asset purchases over the last few weeks. In fact, they’re down to nearly half the pace they had been during their peak last month.
It’s a pretty odd dynamic as we might see further easing measures from the Fed that could push rates below zero, so keep an eye on this sector.
Directional option trades are back in vogue
While historically, high, the VIX pulled back far enough that it’s challenging, dare I say, a normal trading range.
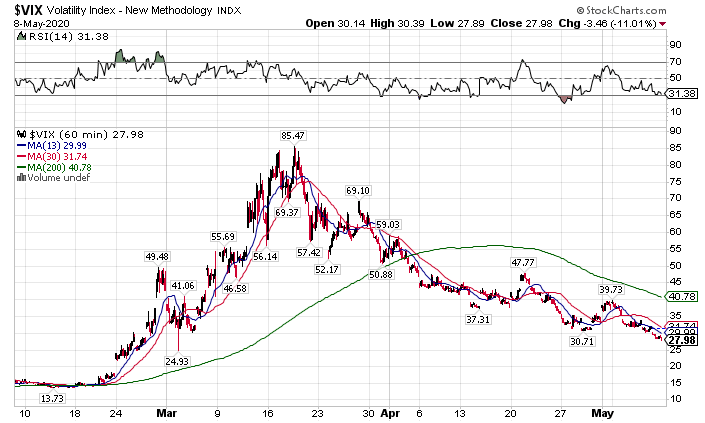
VIX Hourly Chart
That’s pretty crazy considering we were above $85 in March with no end in sight.
Good news is that lower VIX prices tend to mean cheaper directional option plays, something I’ve been taking advantage of lately.
See, implied volatility is just one of several factors that create the price of an option, the other two being time to expiration and distance from the strike to current price.
A great way to learn about this is with my free handbook: Options Trading: The Ultimate Beginners Guide.
Plus, when you’re ready to take it to the next level, you can sign up for my free Total Alpha Options Masterclass.
