Has this ever happened to you?
You have high conviction on a trade so you decide to trade options because they give you more bang for your buck.
You place the trade, the stock does exactly what you thought it would do, but you end up losing money anyway.
Nothing is worse than getting everything right in the trade except for the options contract.
Most traders don’t think about it until the very end. But it should be the first thing that you look at.
Picking the right option contract can mean the difference between hundreds, if not thousands of dollars.
Today I’m going to teach you my options selection process.
This lesson is so critical I’ve decided to make a video for you.

Click here to watch free training video
But your training doesn’t stop there.
I’ve also decided to write it out for you step-by-step.
After reading this I’m confident you’ll become a more profitable and consistent options trader.
Expiration
As I mentioned in the video, I want to go out roughly 2x-4x the amount of time I expect a trade will take to play out. So, if I think it takes a week for the trade to work, I’ll go out 3-4 weeks.
One thing you need to understand is how option cycles work. Some stocks have weekly expirations, while others only have monthly dates. Stocks with weekly expirations are typically more popular and have higher volumes.
However, the drawback is the weekly options may not have a lot of volume on the contracts you want. That means you could face wide bid/ask spreads, which tends to lead to you paying more to the market makers for an option contract.
When I can, I prefer to stick with the option contracts that have the highest liquidity (trade the most often). Especially in this environment, I want to stick with bigger names so that I can capture as much of the move as possible.
Strike Price
One of the key components to any option is the strike price you choose. The strike is the price where the option contract is tied.
For example, if I buy a call option on AAPL at $270, that gives me the right to buy 100 shares of Apple per contract at $270. Conversely, if that was a put contract, I’d have the right to sell that same amount at $270.
Each strike price has a greek value known as a delta that goes with it. The delta tells you how much an option will move for a $1 change in the stock’s price.
At-the-money options are always 0.5 (or negative 0.5 for puts). The further out-of-the-money you go, the lower the delta. As you get further in-the-money, the delta moves towards 1.
This is a graph that shows the relationships between delta, price and time for call options on a $55 stock.
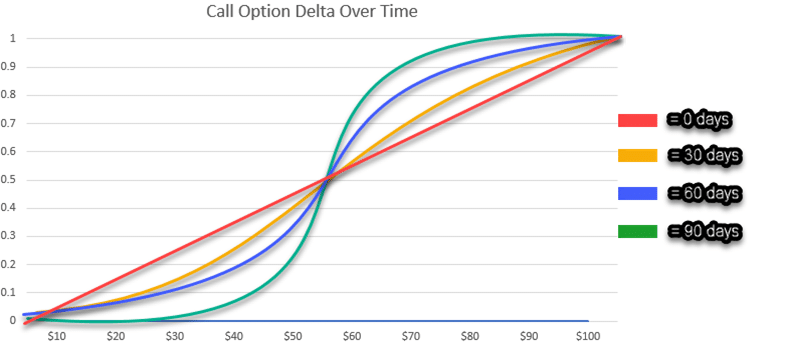
The longer you have until expiration, the more of an ‘S’ the delta curve makes when you graph it against a change in a stock’s price. As you approach expiration, the line becomes straighter.
Now, this means that options further out-of-the-money will move more with the stock in percentage terms, but are also the most exposed to time decay. As a stock approaches expiration, the extrinsic value heads towards zero.
Note: Intrinsic value is the price of an option that would remain if you exercised the option today. Extrinsic value is anything remaining. Once a stock goes above a call strike or below a put strike, it will have an intrinsic value equal to the difference between the stock price and the strike price.
Now, when I trade options, I prefer to buy options that are a little bit in-the-money. That will typically cost more, but I’m hit with less time decay. The highest amount of time decay hits at-the-money options.
Typically, I’ll go for an option that has 0.6 or -0.6 deltas. You can see what that looks like in this option chain below.
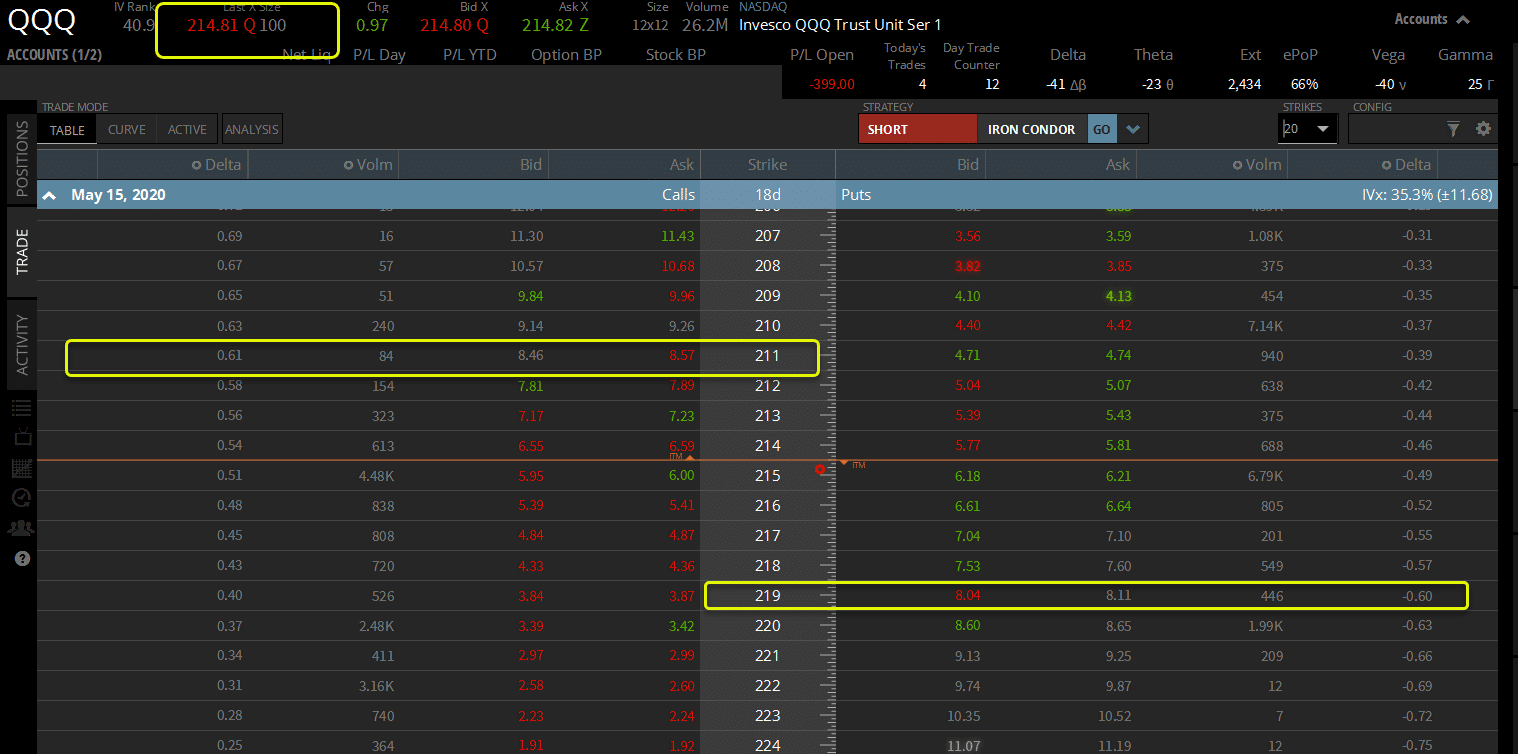
In this case, the price of the stock is $214.81. The 0.6 call option delta would be the $211 call while the $219 put would be the -0.6 delta.
Implied Volatility
The last thing I consider when choosing my option contract is implied volatility. Typically, implied volatility is higher the further out you go and lower the closer you are to expiration.
That means that any opinion I pick will suffer from time decay and potentially implied volatility decay.
So, I want to be careful when I choose my options contract. Every stock has its own implied volatility as well as each option contract.
One of the reasons I never hold option contracts through earnings is because they lose a ton of value after earnings are released. Implied volatility rises into the announcement and falls immediately afterward.
Similarly, when stocks fall a lot (like the recent crash), options contracts get more expensive. That makes it difficult to make money trading long options because you have both time decay and implied volatility decay working against you.
The trick is to balance implied volatility with the chart. I look at the implied volatility rank to get an idea of whether I’m facing historically high implied volatility. IV rank looks at the range for implied volatility over the last year and tells me where the current IV is as a percentage of that range.
For example, if the IV range was from 25-75 and the current IV is 50, then the IV range would be 50%.
Continuing education
Your learning doesn’t have to stop here. I have a free options masterclass coming up where we go into even more detail, discussing key concepts like a stock’s lifecycle. You definitely don’t want to miss this.
