The market has experienced unprecedented over the last two months.
Who could have predicted the economic shutdown, 26M people unemployed, and the collapse of the crude oil market?
However, despite it all, there’s one thing that’s remained consistent.
My Money-Pattern.
That’s what I love to see when I look at my current account in Total Alpha!
Today, we’re going to train your eye to find the money-pattern setups.
You’ll see plenty of examples, including some that I used for trades last week, and some brand new ideas for you to watch for next week.
Tesla’s Bear Pattern
As stocks climbed aggressively off the bottom, I found it difficult to short anything in the market. It felt like I was swimming upstream.
However, Tesla gave me a look that I couldn’t pass up. I wanted to talk about this trade as it has some really interesting elements that made it a natural choice.
Let’s start with the money-pattern setup.

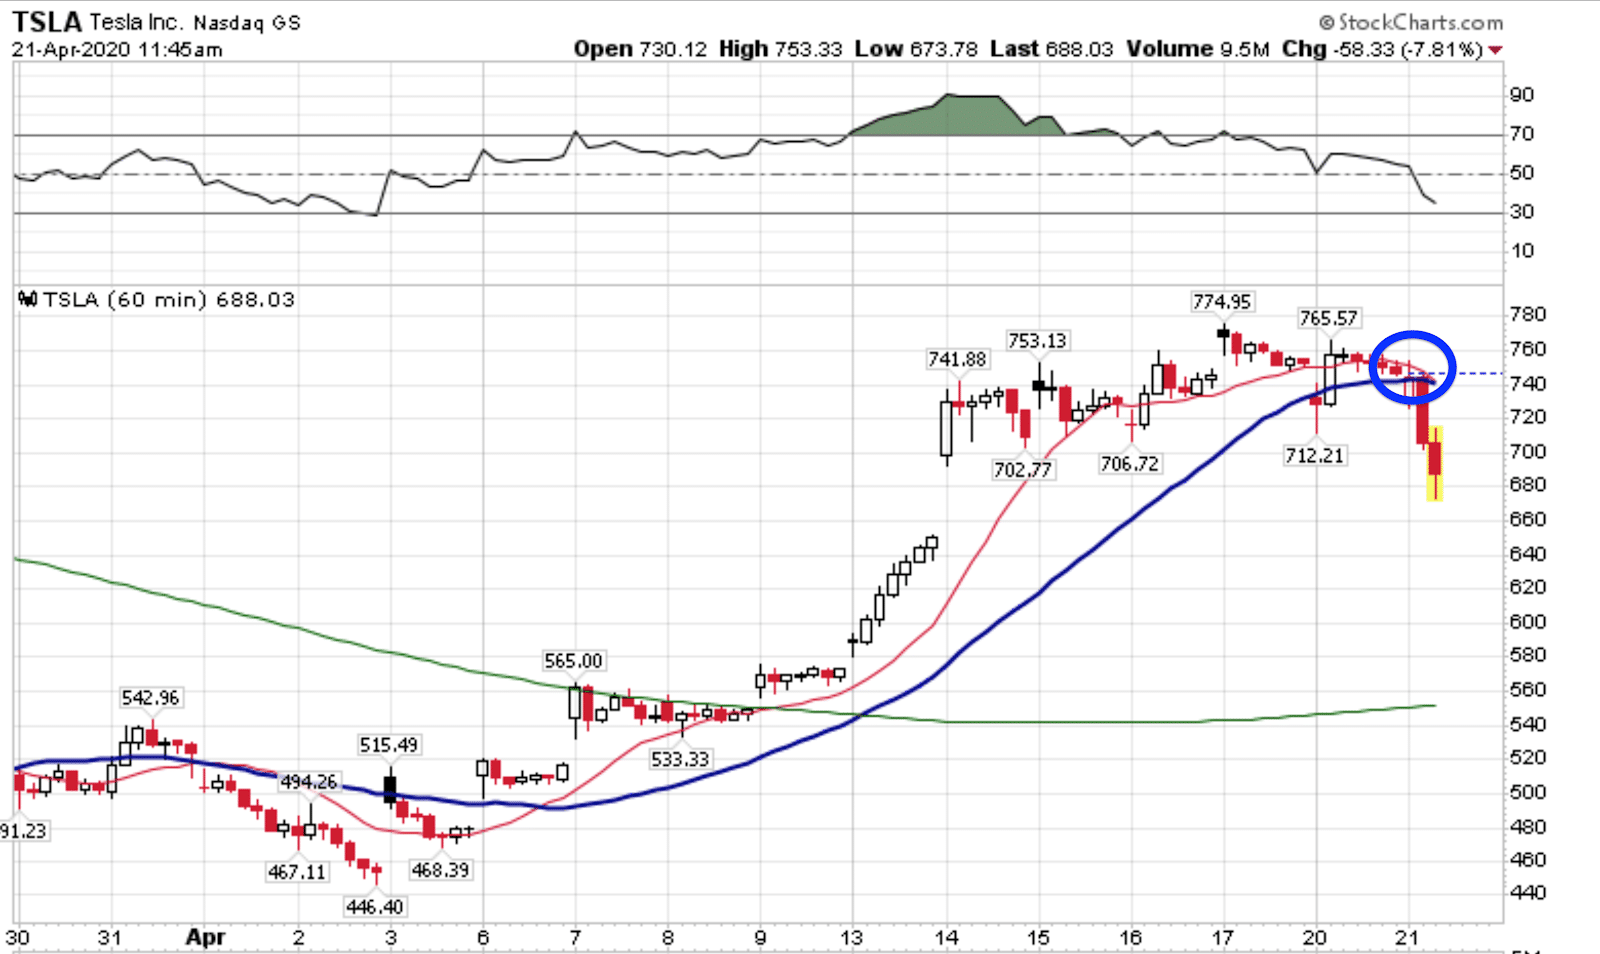
TSLA Hourly Chart
If you aren’t familiar with the money-pattern, let me go over it briefly.
The money pattern uses two simple moving averages: the 13-period and 30-period. I look for a crossover in the two on the hourly chart. Additionally, I want to make sure they haven’t touched one another in a couple of weeks.
With Tesla, you can see how the last time they had crossed was down at $460 at the beginning of April. Since then, share ripped higher until they got close to the round $800 level.
It was at that point they started to struggle. For some reason, buyers weren’t stepping up to the plate.
Once I saw the moving averages start closing in on one another, I figured it was time to make my move.
In this case, I sold a call credit spread rather than buy a put. Call credit spreads are risk defined trades where you sell a call option at a strike at or out of the money and then buy another one just above. That caps your risk to the distance between the strikes less the credit you receive for initiating the trade.
You can learn more about credit spreads in my previous newsletter article here.
The main reason I went with the credit spreads – implied volatility. Implied volatility is a component of an option’s price. The higher implied volatility, the higher the option price. That makes buying puts more expensive.
When I compared implied volatility to the last year, I saw it was in the top tier. So, rather than be a buyer of options, I became a seller. That means any decrease in implied volatility worked in my favor.
With my strikes set at $800 and $810, this trade expires on May 1st. As long as Tesla closes below $800 on Friday, I’ll be collecting a sweet $15,000 profit!
SPY fake out
Sometimes the money-pattern doesn’t work out. It happens. No trade works 100% of the time. How you manage the risk is what separates retail from professional traders.
Recently, the SPY ETF, which tracks the S&P 500, put in a money-pattern clear as day. Next morning, I’m waking up to the market popping higher out of the blue.
Let me walk you through what happened and how I managed my trades.
First, let’s look at an hourly chart of the SPY.

SPY Hourly Chart
When I saw the first arrow on the left, I was absolutely salivating. In fact, I started taking some pretty sizable bets the market would rollover.
Then, it jumped. The moving averages touched, but never really crossed over.
So, I just exited my trades plain and simple.
That’s the thing, I knew I was wrong once the market opened above the highs of the day. I didn’t need anything beyond that.
Even the second time where the moving averages finally crossed, I still used the high of that day as a stop out.
So did I try and fail twice? Yes I did.
Did I lose a lot of money? Not at all.
The key with this setup is to put yourself in a position to make money when the stock or ETF runs while keeping your losses tight.
That’s a lot of why I prefer to use long options on these types of trades. They give me more bang for the buck without having to drop as much capital into the trade.
Applying the money-pattern to stock life cycles
One of the coolest things I learned with the money-pattern was how to combine it with other indicators and ideas to increase my probability of success. Learning about stock lifecycles took this type of trading to a whole new level.
You can learn about stock life cycles for free in my upcoming Masterclass. I’ll explain how to use options the right way, along with a host of other great techniques for your trading.

