There are two things I love in this world: getting a big winner on my Bullseye trade of the week and wearing a bucket hat while sipping perrier in my hot tub.
Mission Accomplished!
That Bullseye trade – netted me over $4,000 before Gilead was even a thing!
And while we’ve seen a strong bounce in several sectors. There are some which I believe will continue to struggle.
Today I want to give you a big-picture breakdown on what I’m seeing.
I’ll be sharing my analysis on biotech, consumer staples, the QQQs, SPY, GLD, USO, and others.
Not only that but I’ll be categorizing them for you based on what the charts are telling me: good, bad, and ugly.
The Good
Right now we’ve got a few sectors that want to step up and wear adult pants. And yes, biotechs are still first on our list.
The sector has been on fire and got an additional boost on Friday when Gilead (GILD) dropped news that their drug trials for the COVID treatment had been going well.
That led to a sector-wide rally that put the XBI biotech ETF in a powerful position to start this week.
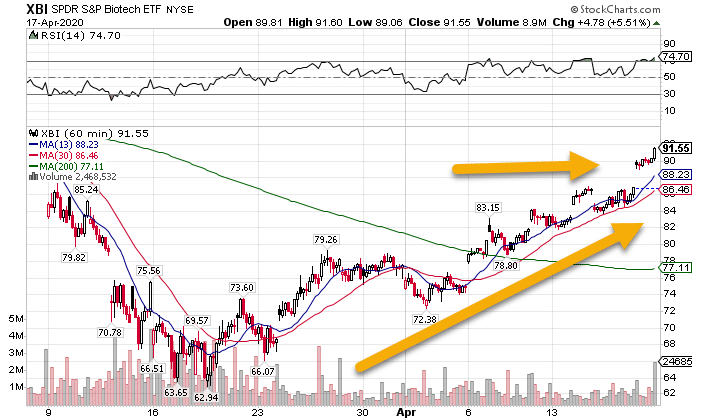
XBI Hourly Chart
It let me snap up some quick cash with my Bullseye trade of the week in Amgen (AMGN) before Gilead’s news was a thing.
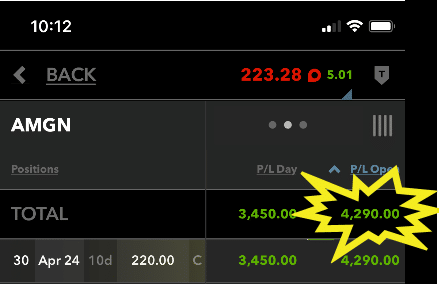
Charlie Sheen calls this winning
Not far behind our pharmaceutical friends are the consumer staples. With everyone hoarding toilet paper like we’re about to lose indoor plumbing, shares of everything from Clorox to Kroger have been lighting up the charts.
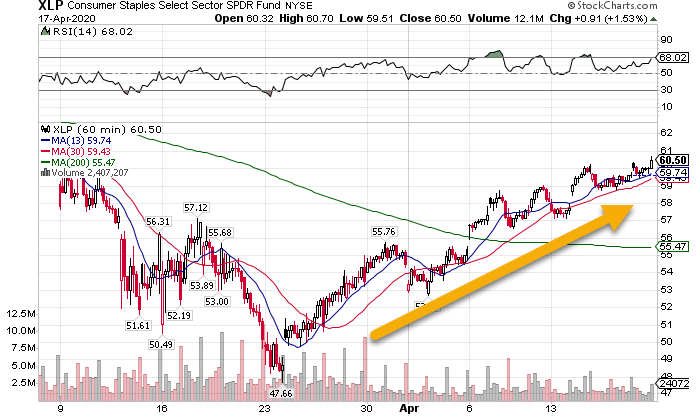
XLP Hourly Chart
Make no mistake, with companies like Wal-Mart looking to hire thousands of workers alongside Amazon, they’re banking on folks taking an extended stay in the homestead.
Unsurprisingly we have a lot of bored Karens and Kyles whipping out their credit cards to pick up the non-essentials to plug the holes in their souls.
Newsflash, buying things you don’t need online won’t make you feel better, but I love it since it gives me some sweet trades!
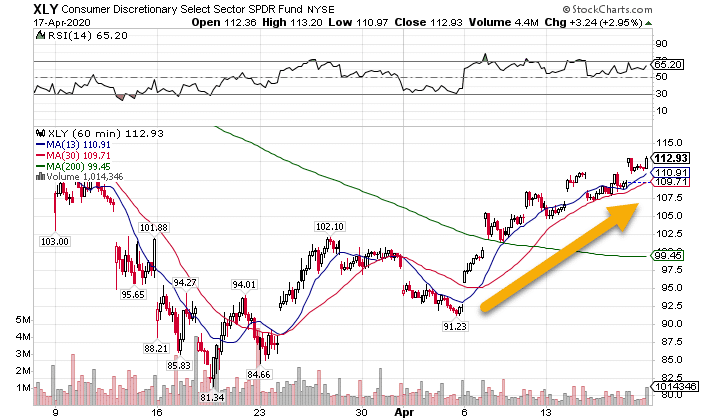
XLY Hourly Chart
And while Karen and Kyle shirk their work from home, their employers keep close watch through the monitoring technology they have no idea is logging their every keystroke.
In reality, the QQQ ETF that tracks the Nasdaq 100 has been on a tear recently because of Amazon’s meteoric rise. However, it’s about to run into some serious resistance.
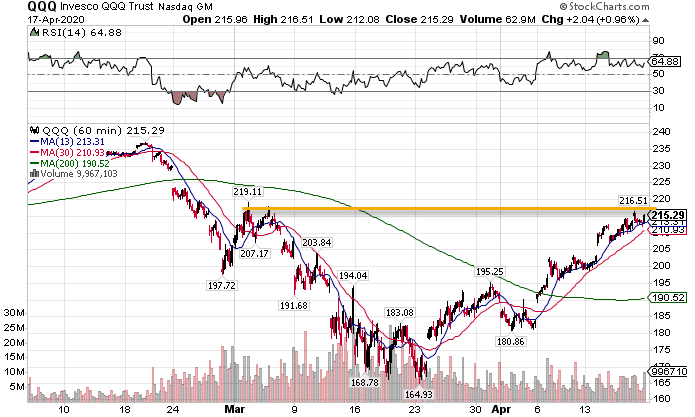
QQQ Hourly Chart
It may take more gas than tech has in the tank to push through these levels. But then again, with the Fed behind you, anything’s possible.
Speaking of resistance, the SPY ETF found little of that on Friday when it did it’s best impression of Elton John’s Rocketman.
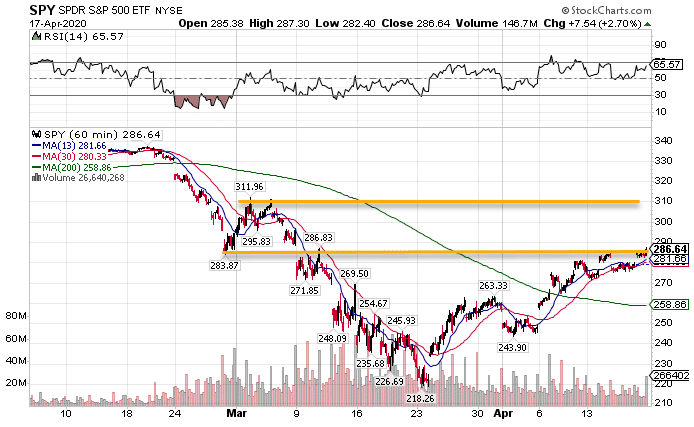
SPY Hourly Chart
Now, things start to get interesting. We’re about to get to a 61.8% Fibonacci retracement around $292. That’s right in a resistance zone.
However, everyone is watching it. So does that make it less likely to work or more likely? Market crashes happen when you don’t expect them, not when you do…
The bad
For all the rings and fine jewelry I own, gold seemed to have lost its allure. Oddly, it’s been trading in tandem with equities. Usually, we see it as a ‘safe haven’ for money fleeing the markets.
Nonetheless, it’s topped off for the near-term, even creating a clear money-pattern to the short side.
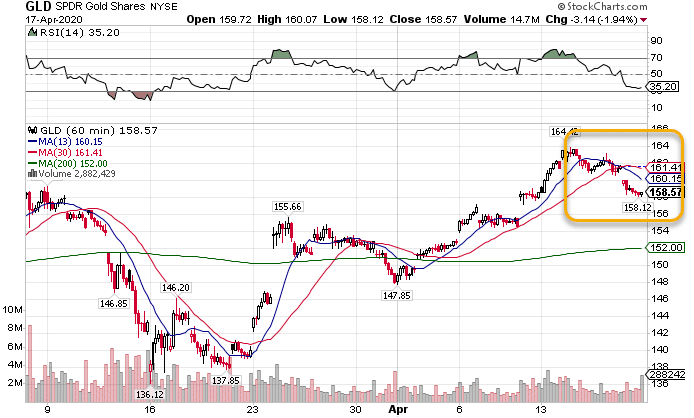
GLD Hourly Chart
Investors must be getting more bullish (or at least losing their sense of reason) since bonds can’t seem to gain any traction.
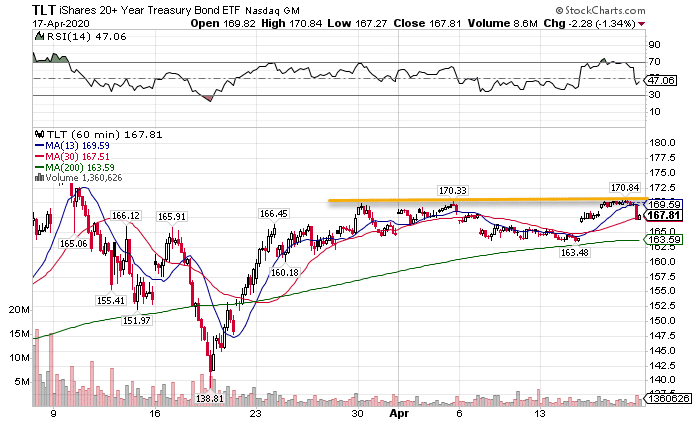
TLT Hourly Chart
The current top just above $170 looks like the target to get over. Otherwise, we’re headed back down to find support at the 200-period moving average (AKA the gravitational line).
The Ugly
And lest we forget, that for all the decrees to strengthen our manufacturing and ‘buy-in America’ campaigns, the industrials look worse than a college kegger the morning after.
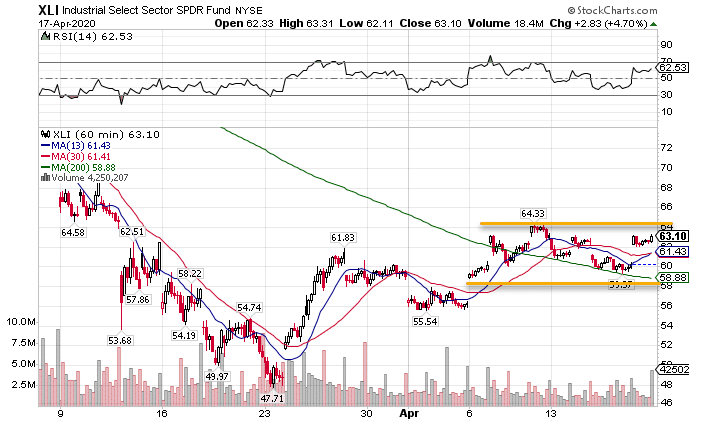
XLI Hourly Chart
Rangebound, these lovely companies rely on actual growth, not juiced up balloons inflated by the Fed.
Same thing goes for the small caps. These little guys need actual growth to move ahead. So, while they may bounce the hardest, that’s like being the
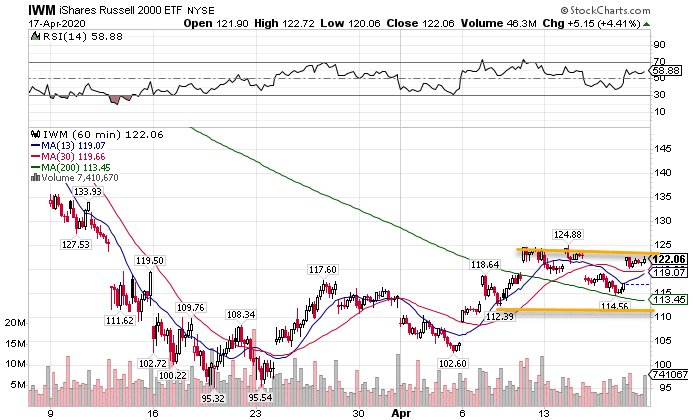
IWM Hourly Chart
And The Truly Fugly
If there was one sector I could give the Darwin award to, it would be energy.
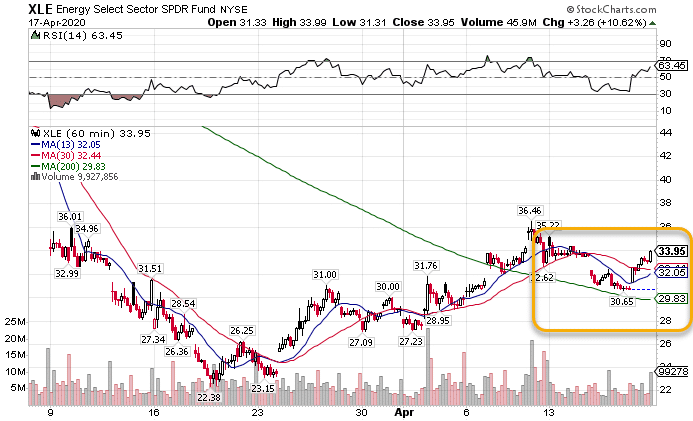
XLE Hourly Chart
This sector is dying a slow death that is more befitting a B-horror film than a major S&P sector. Heck, just a few years ago Exxon Mobile was the largest company by market capitalization in the world.
If the USO oil ETF was a chart of a company, I’d think they were headed into bankruptcy.
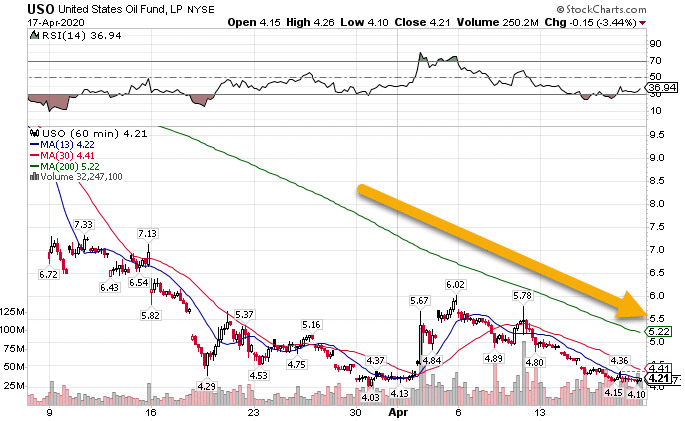
USO Hourly Chart
Even J.C. Penny didn’t have it as bad as the crude complex.
But you’re in luck
I’ve got two words for you – Masterclass. Maybe counting wasn’t my thing, but trading definitely is.
That’s why I’ve got a free Masterclass starting up shortly that will get you the goods on how to make some sick profits that might be the cure for what ails you.
