Deep down below this posh exterior, I’m a math nerd. Nothing excites me more than using clever calculations to make profitable trades.
Just the other day, I applied Fibonacci Retracements to claim my prize with Zoom Media (ZM).
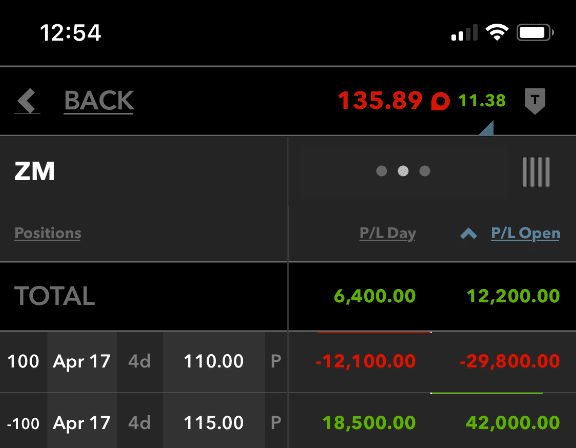
I’m shooting for a total profit of $16,500 by Friday’s expiration!
If you’ve never used this tool, it needs to be part of your repertoire.
Fibonacci Retracements are used by retail and professional traders in every market. Some folks make an entire living trading off them.
It’s by far, one of my favorite mathematical indicators to work with.
And today I’m going to teach you how to add this powerful tool to your arsenal.
If you want to improve your entries as well as better time your exits then…
What is This Fibonacci Magic?
Back around the year 1200, Leondardo Bonacci (AKA Fibonacci) released his work in the Liber Abaci. In it, he introduced the concept of the Fibonacci sequence.
The Fibonacci sequence comes from the giant numbers triangle you saw in middle school. It looks something like this.
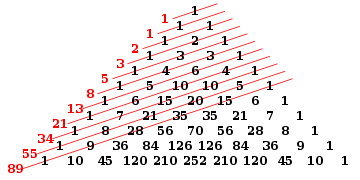
Pascal’s Triangle
In the triangle, each row of numbers is the sum of the two numbers up and diagonal to that position. For example, at the bottom, 210 is the sum of 84 and 126.
Down the left side, you’ll see the numbers in red that add all the numbers along a diagonal. These are the Fibonacci numbers.
When you use them to create ratios, you get patterns that we see in nature, such as the spiral.
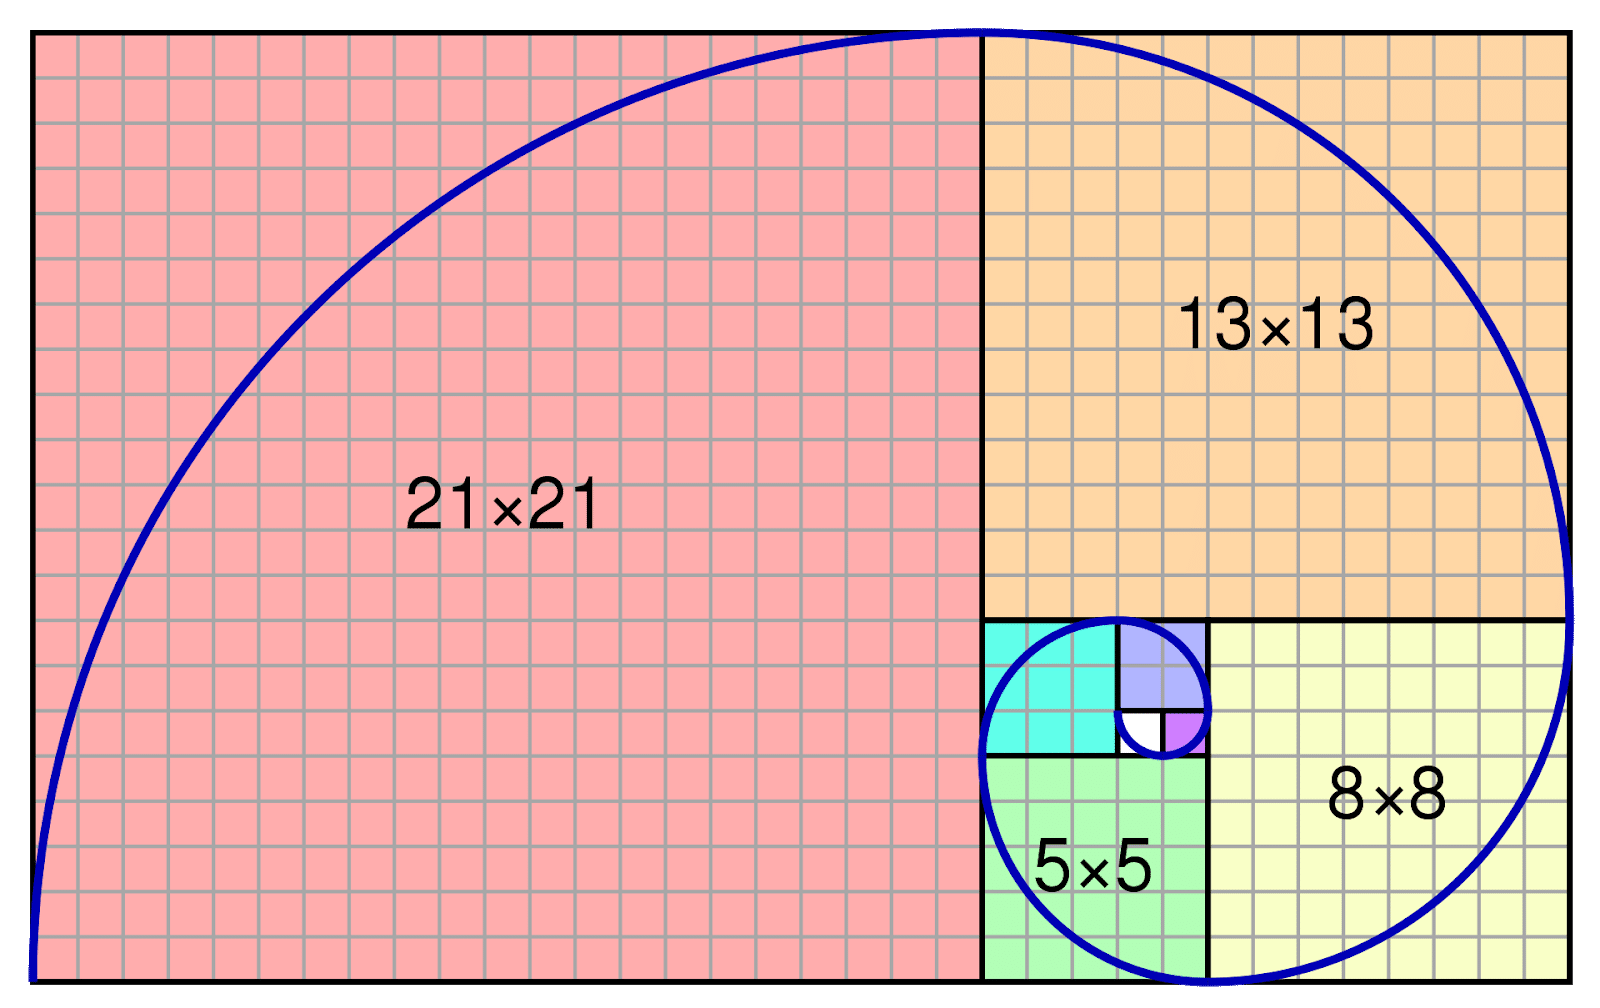
Fibonacci Spiral
If you take one number and divide it by the previous values, you start to get the percentages we use for Fibonacci Retracements.
In trading, the main retracements are 23.6%, 38.2%, and 61.8%. We also use 50% and 76.4%, but they are not part of the sequence.
Try dividing 13 by 21, what do you get? 0.619. How about 8 by 13? 0.615, how about 8 by 21? 0.381. Keep going, and you’ll get closer to the percentages!
Now that I’ve got my inner nerd out of the way, let’s talk about how to use them.
Applying Fibonacci Retracements
Fibonacci retracements rely on two points. These should be obvious highs and lows in the chart that stand out.
What you’re going to do is calculate percentages between the main nodes. While you can do this manually, most platforms have a built in tool.
Let’s use ZM as our example. Here I have the 60-minute chart of the stock.
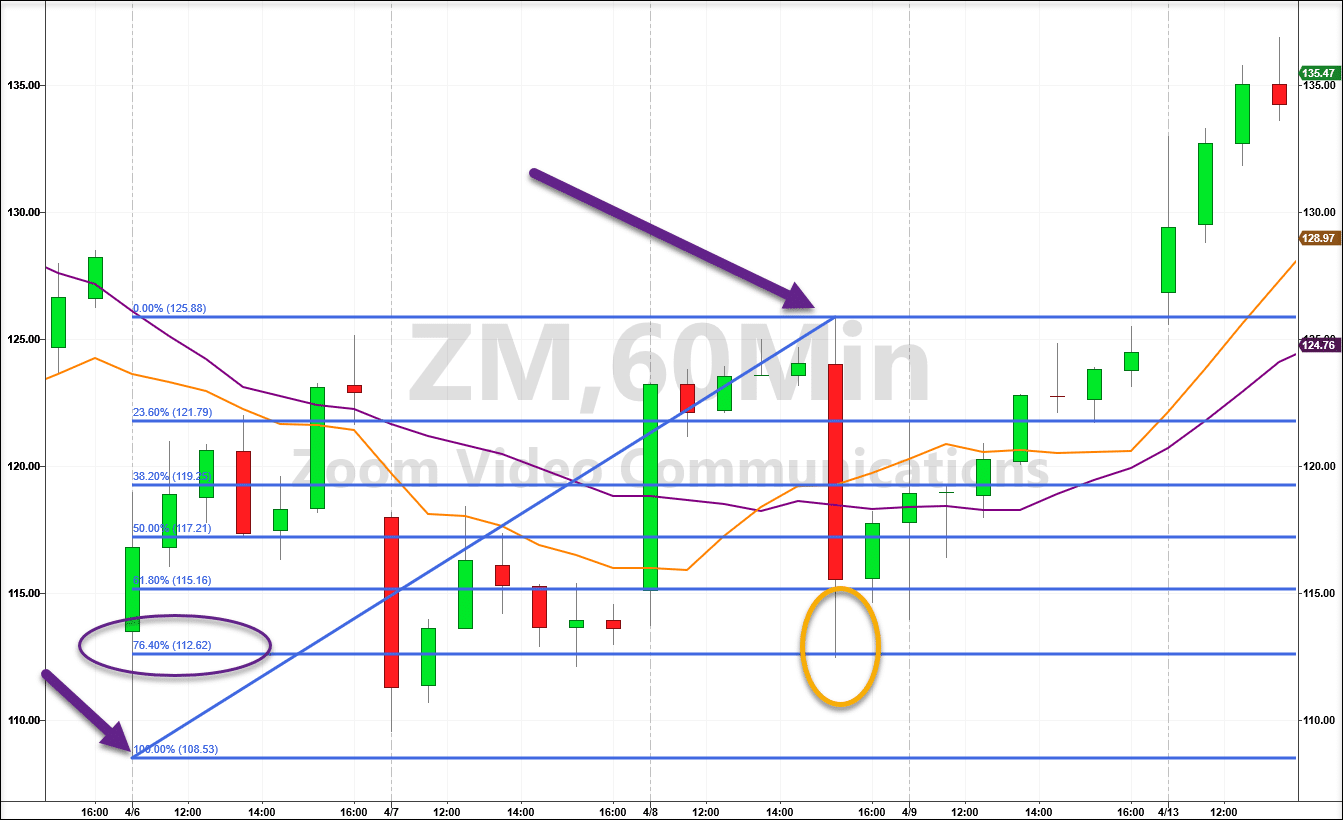
ZM Hourly Chart
Let’s start with the two purple arrows. They point to the swing high and low points in our series
Note, when you are drawing a retracement lower, the swing high should come before the swing low. When you draw retracements higher, the opposite occurs, with the low before the high.
Using my platform Fibonacci tool, I get the following values:
- Swing high – $125.88
- 23.6% level – $121.79
- 38.2% level – $119.25
- 50% level – $117.21
- 76.4% level – $112.62
- Swing low – $108.53
Now, I want you to think about the risk/reward ratio. If my stop is the 100% level, where should I consider entering the trade?
Well, that depends on my target and my expected win-rate. Typically, the higher your goal, the lower the win-rate.
I like to give myself a conservative risk/reward ratio. That’s why I try to pick up entries above 50% with a stop at the 100% retracement level.
For this play, you can see how I grabbed it right off the 76.4% support, almost to the penny. From there, the rest is history.
Applying Fibonacci To Trading
Now, like most trades, I want more than one reason to justify my setup. While Fibonacci levels give me a great start, that’s not enough for me to just pop into the position.
In this case, I had one other big reason for entering. Check out the circle on this chart below.
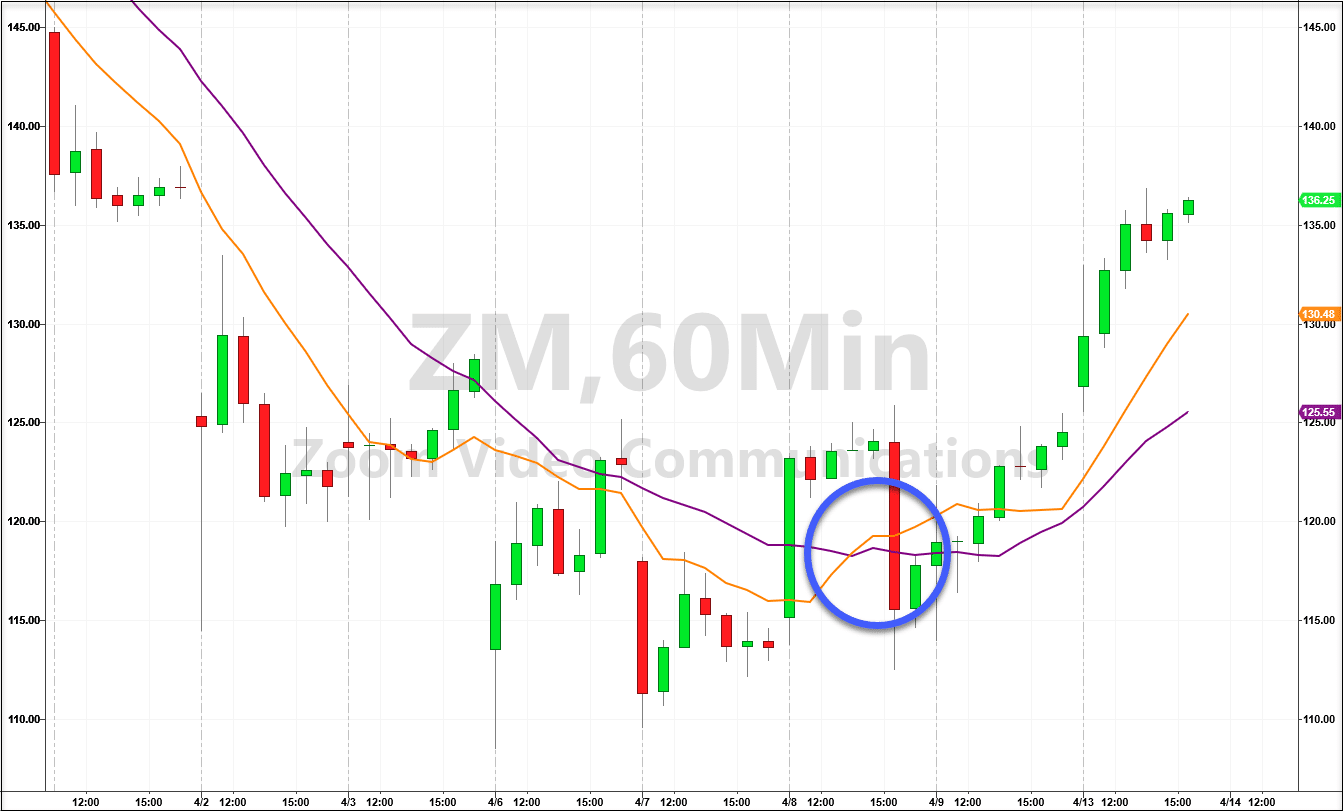
ZM Hourly Chart
That right there is the money-pattern. This occurs when the 13-period moving average crosses over the 30-period moving average on the hourly chart. It signals a trend change from bearish to bullish on the stock.
So, I had two pretty solid reasons to take the trade, both from different indicators. To me, that’s enough to get into a position with a defined risk/reward setup.
That’s why I used a put credit spread, so I knew exactly how much I could win and lose from the get-go.
Get Even More Training
Fibonacci retracements are just one of the many tools I use in my trading. There’s a whole lot more that you can pick up…for free!
Join me in my upcoming Options Masterclass. You’ll learn about the lifecycles of stocks and get into the world of options trading in a way you’ve never seen before.
