Every successful trader has their one go-to strategy.
My favorite setup – the money pattern.
Just the other day I was able to put its full force behind some trades that delivered some humongous profits during the face-melting rally.
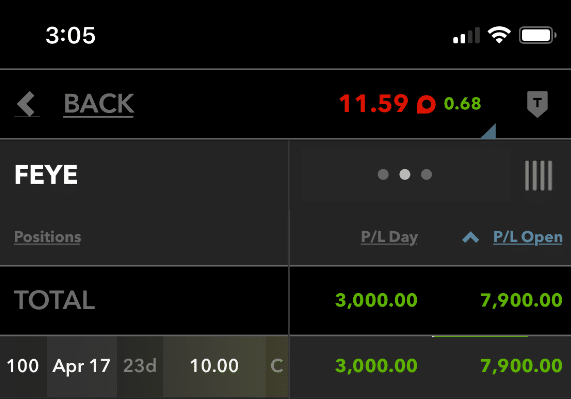
Nothing to see here, just one trade paying for a year’s worth of Total Alpha and then some!
Yes, despite all the uncertainty and headline risk we have in stocks.
The money pattern still comes out to play.
Today I’m going to show you how it works, and most importantly, how you can start applying it for bigger and better trading results.
This is a lesson you can’t afford to miss.
Also, as a proud stakeholder with ownership interest, we’d like to offer you the opportunity to check out this wonderful company and get in on their limited run of hand sanitizer to keep you and your family healthy and safe.
Click here to learn more about GRN Hand Sanitizer.
What is the money-pattern
Years ago, I found out that I preferred swing trading over day trading. Part of that came from my discovery of the money-pattern.
The money-pattern uses an hourly chart and two moving averages: 13-period simple moving average and the 30-period simple moving average.
What I’m looking for is where the two crossover. However, it can’t just be any old crossover. I want to see the crossover happen after the two haven’t touched in at least a couple of weeks. The longer they’ve been apart, the better.
Here’s an example with the SPY chart.
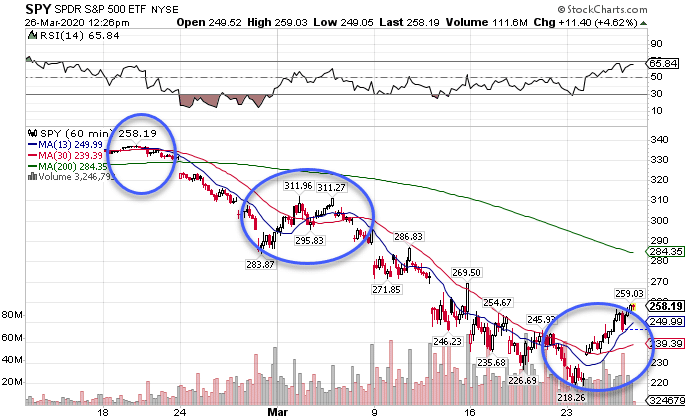
SPY Hourly Chart
I highlighted three different areas where the two crossed paths. The first one is right before markets took their faceplant. The second is when they did a little fakeout in early March. The third is the true money-pattern crossover that signaled a direction change in the market.
You’re probably wondering why it didn’t work in the second circle. It did, in fact, work for a day or so. However, it hadn’t been that long since the averages last touched. Compare that to the last crossover that was over three weeks later.
What does it tell us
The money-pattern isn’t some magic formula that I have a patent on. It’s a combination of a slow-moving average and a fast-moving average. There are dozens of combinations that work just as well.
For example, Nathan Bear’s Weekly Money Multiplier uses an 8-period exponential moving average and a 21-period exponential moving average.
All of this rests on a simple premise; the slower average shows the larger trend, while the quicker one indicates recent price action. When they move in different directions, it tends to mean that enough pressure has come in to stop the longer-term trend.
Note: This doesn’t apply in sideways markets.
How I applied It to my trades
Earlier I brought up my FireEye (FEYE) trade. I want to show you how I used the money-pattern to create a trade for my Bullseye Trade of the week and Total Alpha.
Let’s take a look at the hourly chart pattern.
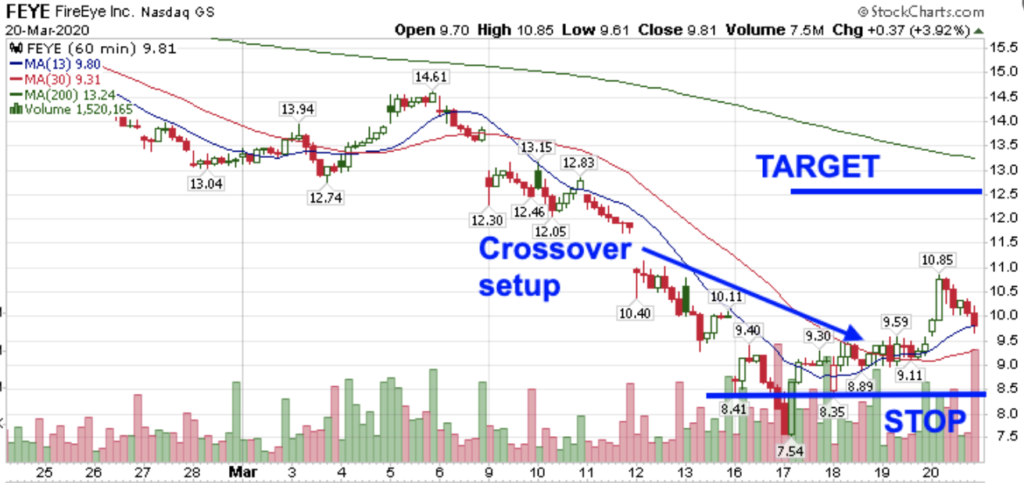
In this chart that I sent out, I noted the crossover setup that I saw. Notice how this occurred long before the market actually found its bottom.
That’s what makes this so powerful – the pattern becomes more important than a plunging market!
In order to get into the trade, I waited for the stock to pull back into the moving averages. That’s a common way I’ll get into the trade with stops below the recent consolidation area (which is noted by the blue line on the chart).
Stocks that show promise right now
Let’s take a look at a few stocks that give the money-pattern crossover and look to be good pickups.
We’ll start by taking a look at the makers of cake snacks, Hostess (TWNK).
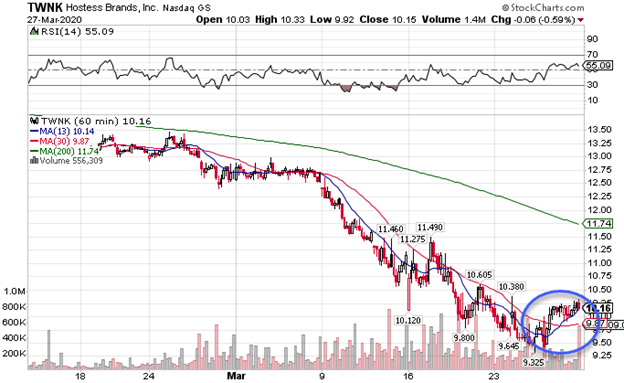
TWNK Hourly Chart
I like this play for a few reasons. First, the crossover just occurred, so it hasn’t had a chance to play out. Second, it’s making a nice consolidation pattern here right on top of the 13-period moving average. Lastly, it’s a consumer staple product. With everyone stuck at home, they’re either drinking or eating snacks.
Here’s one I’m watching as a potential bearish play. Check out the chart for Lululemon (LULU).
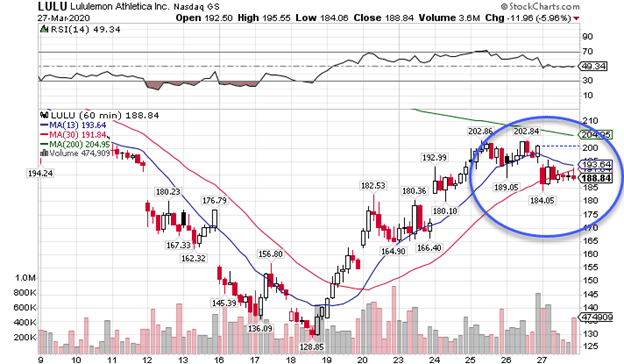
LULU Hourly Chart
LULU is about to have a bearish crossover. Although this hasn’t had as much time as I would typically want, the stock has a lot going against it. Retailers are taking it on the chin in this environment plus it’s right up near the 200-period moving average that also acts as resistance.
Add to all of that it closed multiple hours and then the day below both moving averages!
Learn through practice
Look for these patterns and study them. See how they work in different market environments and contexts. Make repetition your friend.
One of the best ways to cut the learning curve is to watch a mentor trade through these markets. That’s where Total Alpha comes in.
You can get a live feed of my portfolio streamed right to your desktop along with tons of education and training.
