Despite stocks posting its first back-to-back day of gains in almost two months.
Don’t think for a second we’re out of the woods.
More importantly, expect volatility to remain relatively high.
After all, the last few weeks have been unprecedented.
We’re seeing storied companies lose massive market capital in a matter of days.
Heck, even theme parks like Six Flags (SIX) are being priced like they’re going bankrupt. Who knows, maybe they will.
But if you don’t appreciate how vital volatility is, you’re missing out on some great opportunities that I want to introduce you to.
In the meantime, I’m taking a methodical approach to my trading and striking when the iron is hot.
With implied volatility through the roof, I took the plunge and sold a put credit spread in Boeing (BA) in my Total Alpha Portfolio.
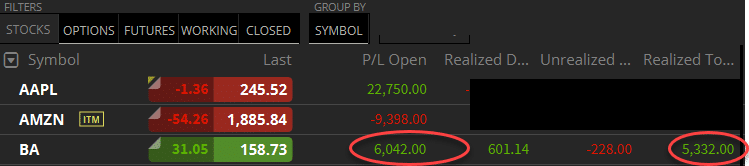
I walked away with a healthy +$11,000 profit!
Understanding market volatility is critical in today’s market. It’s the difference between making bank and draining your account.
That’s why I created a video segment specifically discussing how I work through this issue.

Click here to watch my free lesson on market volatility
Take a moment to watch it.
It will help you with understanding this mini-guide on volatility I just put together for you.
There’s going to be a ton of opportunity throughout the year for option sellers.
It’s time you stretch yourself to learn and get better.
A pause in equity volatility?
Since the start of this stock collapse, volatility has steadily risen unabated. Only when we got to quadruple expiration did the VIX finally start to come off its historic levels.
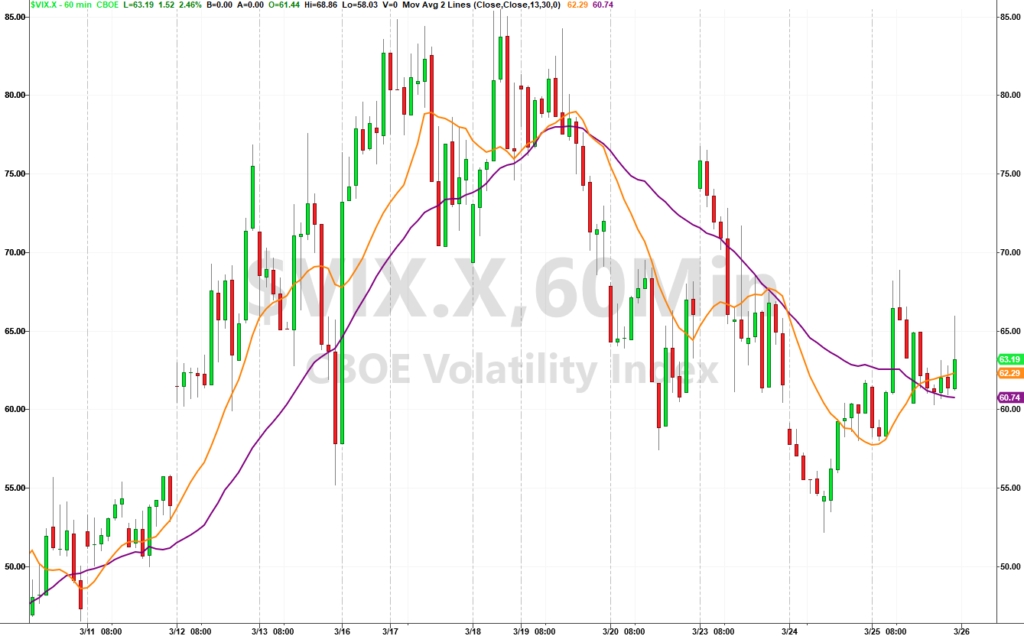
VIX Hourly Chart
Education Station: Quadruple witching refers to the 3rd Thursday of the 3rd month of every quarter. This is when you get stock options, index options, single stock futures, and index futures all expiring at the same time. Usually, this makes this a choppy week!
Remember, the VIX measures the option demand (AKA perceived volatility) of the S&P 500. You’ll often hear it referred to as the ‘fear gauge’ since it likes to trade in the opposite direction of equities.
However, it’s a good signal for when we’ve reached a bottom, as is its friend, the VVIX. The VVIX measures option demand (implied volatility) on the VIX. When traders buy more options on the VIX, it tends to mean they think the market is about to plunge.
Right now, we see a divergence as the VVIX hasn’t come off extreme levels by any meaningful amount.
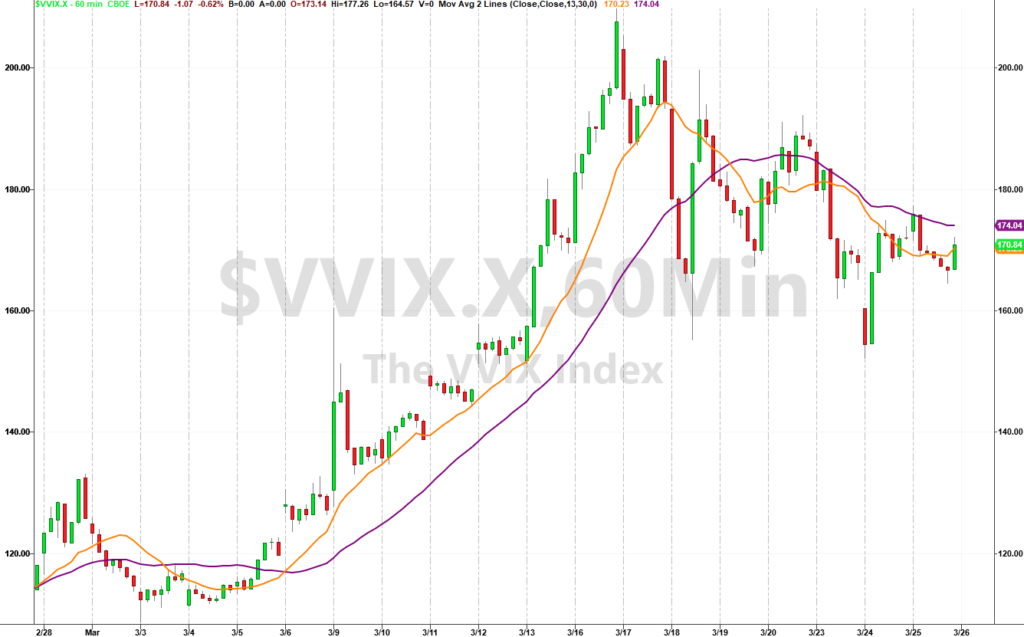
VVIX Hourly Chart
Taken together, these metrics say that the market dive isn’t over by any stretch. Frankly, when I see both stocks and volatility rising together (as we saw the past couple of days), that tells me traders still want to own protection…that they don’t believe in the rally.
Volatility isn’t limited to stocks
Most of us rarely pay attention to a commodity, precious metal, or bond markets for that matter. Yet, they’re offering up some of the most insane discounts in history.
You might not be aware, but there are volatility indexes for most products out there. Take a look at the Silver volatility index.
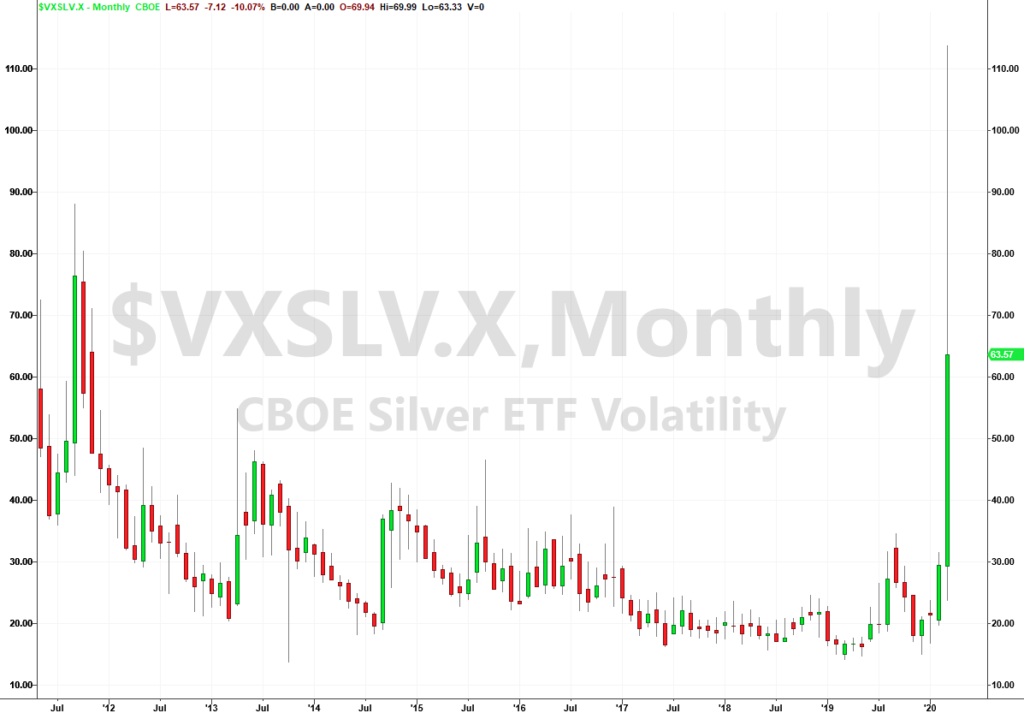
Silver ETF Volatility Monthly Chart
Talk about crazy – we saw silver prices cut in half recently on a jump in volatility that has never been measured before. So, when I say there are historic opportunities out there, I mean it!
Heck, check out crude oil’s volatility. Even during the massive decline in prices brought on by fracking, we never saw volatility like we’re experiencing.
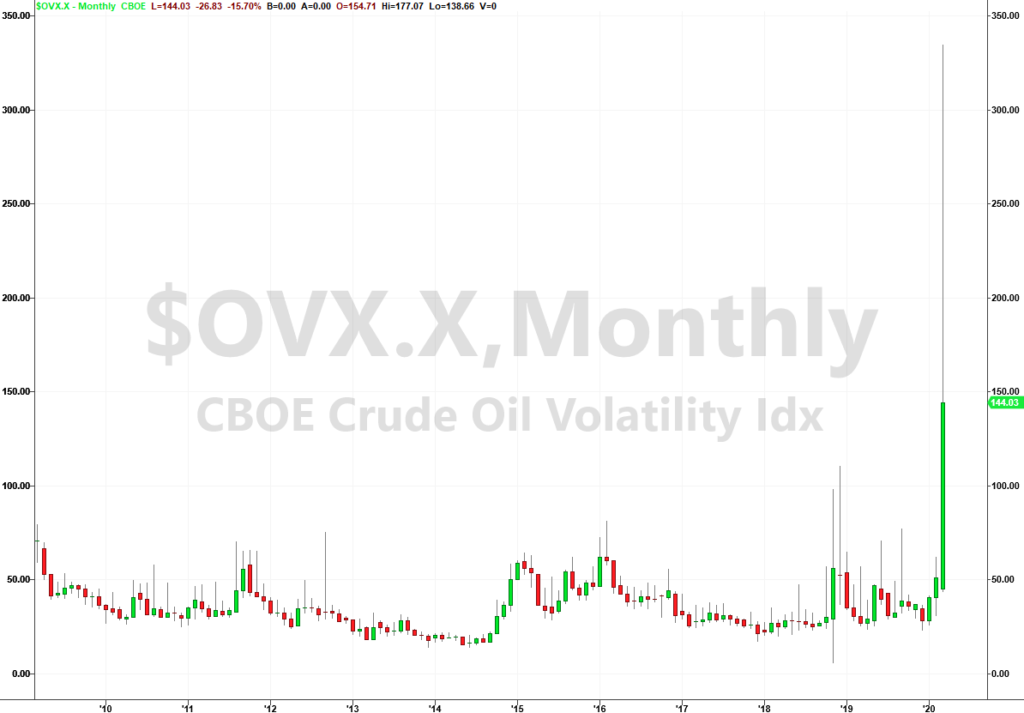
Oil Volatility Monthly Chart
Is it sinking in yet how you can throw a dart and find a tradeable opportunity?
A skewed view
One important concept you need to be aware of is volatility skew. For today, I’m going to refer to it as the difference in implied volatility between strikes equidistant from current price:
In layman’s terms – If a stock is trading at $100, I want to compare the implied volatility for the $105 call and the $95 put since they’re both $5 away.
Think of implied volatility as the demand for the options. Right now, we see a lot more fear from traders as they bid up put protection against their portfolios. That’s led to a skew that makes put options more expensive.
Going back to my Boeing trade, that’s a lot of why I chose to sell a put credit spread on BA rather than buying calls. Elevated volatility on that stocks’ put options made them extremely expensive, which is excellent for option sellers.
That let me sell this defined risk trade much further away from the current price then if I did the same thing on the call side. This is exactly how you can take advantage of the current market conditions.
Hold your horses
Before you go out and start throwing money around like a drunken sailor, realize that I’m not saying I need to be involved in all of these right now.

Far from it!
Trading requires a methodical approach based on robust analysis and a clear strategy. The best place to start putting together these puzzle pieces is with my free options masterclass.
Whether you’re a new trader or seasoned pro, you’ll take away valuable information that can help you improve your trading
Rather than let the Coronavirus lull you into a Netflix marathon, treat yourself to an education that pays for itself.
